Average Click-Through Rate: What Is Average Click-Through Rate?
What’s a good CTR, or click-through rate for Google Ads? Simply put, there is no one-size-fits-all answer. What is and what is not a good click-through rate depends on your niche. Read on to learn everythin
What is average click-through rate?
Average CTR (or average click-through rate) is the ratio of ad clicks to impressions in your Google Ads campaigns. While basic CTR measures the rate of clicks on each ad, average CTR calculates the number of clicks vs. impressions across your campaign, or for each individual keyword.
Low average click-through rate
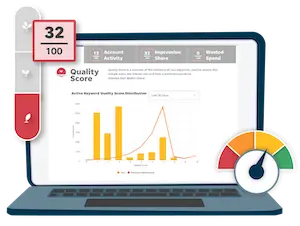
A low average click-through rate is problematic, as it can drag down your Quality Scores and affect future ad placement. Low CTRs signal a lack of relevance for your ad viewers, who aren’t inspired to click on your ad and visit your landing page to learn more about your offer or take the desired action.
Better keyword targeting and negative keyword discovery can help you improve your CTRs, reducing wasted spend and improving your Quality Scores.
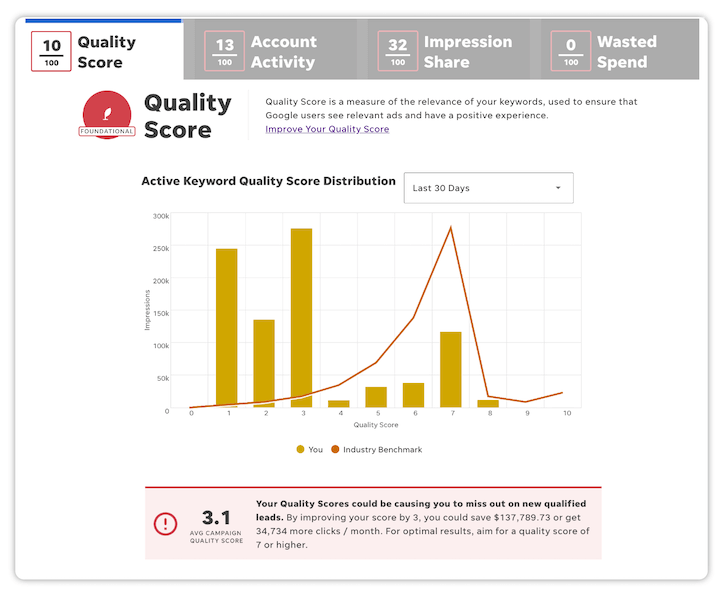
Want to increase your average CTR? Run our Google Ads Performance Grader and find out how.
High average click-through rate
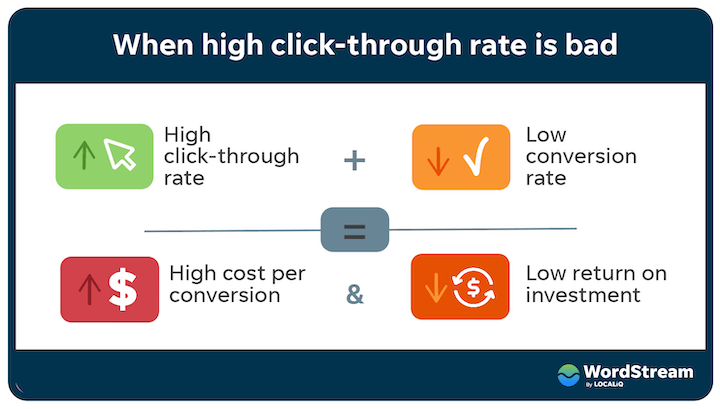
On the other hand, a high average CTR, either across your campaign or for a specific keyword, doesn’t always mean success. It is one indicator that, when combined with other KPIs (key performance indicators) can point to the success of your campaign. However, high average CTRs with low conversions may actually mean that you’re wasting spend by attracting people less likely to convert.
This may be caused by targeting that is too broad, irrelevant ad copy, or a combination of both.
What is the average click-through rate in Google Ads?
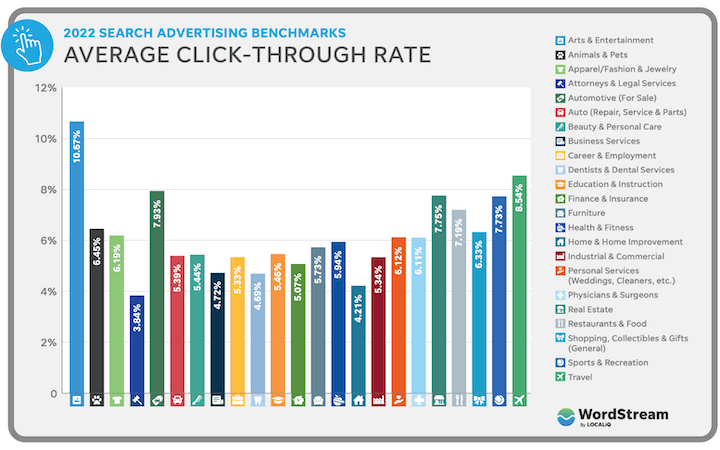
The average click-through rate on Google Ads paid search ads is 4-6%. CTRs are going to be lower on the display network, which is why it’s important to leverage enticing display creative.
However, it’s important to note that average CTR, as well as other key metrics, like conversion rate, can vary widely by industry, because some industries are more competitive than others and consumers behave differently from one industry to the next. So the best way to know if your CTR is higher or lower than average is to look at industry-specific benchmarks. Below, you’ll find benchmarks for average CTR for 20 common industries:
 View our online advertising benchmarks here.
How does your average CTR stack up against competitors?
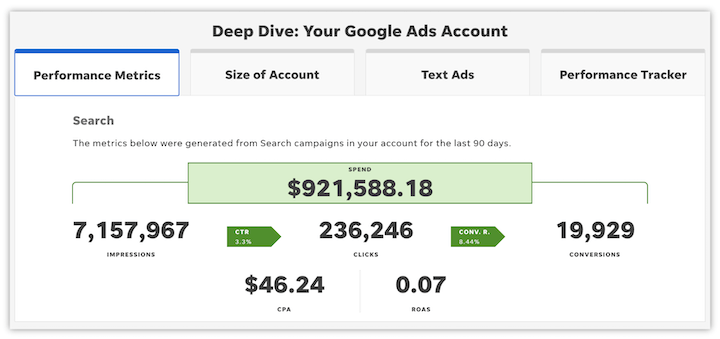
Our free Google Ads Performance Grader analyzes your account against several different factors, offering insight for improvements across major KPIs including Quality Score, account activity, wasted spend, and impression share. You’ll also see how your performance in these areas compares to other advertisers in your industry, for the most accurate view into your competitive edge.
In seconds, see how your top 200 keywords perform against industry benchmarks, gleaned from our analysis of billions of dollars in Google Ads spend. Drill down into specific keywords from your campaigns for impressions and average CTR data, then get to work implementing our personalized recommendations.
The Google Ads Performance Grader helps you understand how keywords are performing against others in your campaign, as well as your competitors. See which keywords are weighing down your Quality Scores with low average CTRs and learn how to bring in more leads with better ad targeting.
Improve your ROI with Google Ads recommendations
Keeping an eye on Average CTR can help trim wasted spend, especially when your CTRs are acceptable or even high, yet conversions are low. Our analysis and recommendations will highlight opportunities to improve targeting, raise or lower average CTRs and increase conversions using ad copy, negative keywords, or other strategies.
In addition to a simple visualization of your top-performing keywords within the Google Ads Performance Grader, you’ll find recommendations to help optimize your average CTR for more effective and relevant ads, more leads and a higher Quality Score. Our free tool also shares the expected impact of recommended changes.
You’ve always been able to see an overall average CTR score within your Google Ads Performance Grader dashboard, but with the release of our new “Plus” version, you can see how your performance trends over time. Every 30 days, your account is automatically evaluated, with historic performance information available from the dashboard.
Understanding your Average CTRs is critical for reducing wasted spend, recognizing how PPC keywords and campaigns translate to leads and sales, and optimizing your campaigns for greater conversion and overall effectiveness. See how your campaigns rate in eight key areas and learn how to make the necessary improvements using our free Google Ads Performance Grader.
You may also want to download our free guide to increasing your click-through rate: 10 Tricks to Get the Click: How to Write Exceptional PPC Ad Copy.