We recently concluded our series on AdWords ad extensions, and thought we’d take a similar approach to a series of reports that live under the Google AdWords Dimensions Tab. Many people rely on the main AdWords tabs for their standard reports – at the campaign, ad group, keyword, and ad level – but there are a series of AdWords reports that offer a ton of great data all rolled up under the dimensions tab.
In this guide to using the AdWords dimensions tab, we’ll be breaking out each of these reports and showing you:
- How to pull the report and manipulate the data
- Why this report is (or in some cases isn’t) important
- When the data will be helpful and actionable (and in some cases: when it won’t be)
Available Reports in the AdWords Dimensions Tab
Below is a brief explanation of each of the reports – click the heading to find more detailed information on each report:
- Time – This is dayparting information – the drop down allows you to slice and dice your data by day of the week, hour, etc. to gain insights about when your campaigns are the most successful. Click here for more information on the time report and dayparting.
- Conversions – This gives you some additional information around your conversions – specifically a breakdown by conversion name or purpose.
- Destination URL – This report shows you how specific destination URLs within your campaign are performing.
- Demographic – This applies to certain sites on the content network that collect demographic data, and shows you the breakdown of how different demographics are responding to your campaigns.
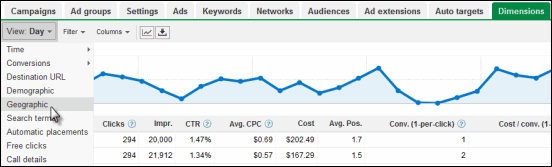
- Geographic – This report lets you slice and dice data by geography so you can better allocate your funds across different countries, states, etc.
- Search Terms – This is effectively a search query report, and shows the same data you would get via a query report in the keywords tab.
- Automatic Placements – This report shows you the placements your site is being placed on on the content network – it’s a bit like a search query report for content and display campaigns.
- Free Clicks – The free clicks tab is something Google calls the ad interactions report, and shows you how people interact with different components of your ad, such as “get directions” or the product extensions ad plusbox.
- Call Details – This report shows you actual data from the call metrics feature assuming you’ve enabled it, such as durations and area codes of calls.
Again we’ll walk through each of these in greater detail as the series continues. Stay tuned!

Meet The Author
Tom Demers
Tom Demers is the co-founder and managing partner of Measured SEM. He has over a decade of experience helping businesses generate meaningful growth through SEO, PPC, content marketing, and online publishing. Formerly the Director of Marketing at WordStream, Tom has also worked as an in-house SEO specialist, SEO manager, agency consultant, and independent search marketing advisor. Through Measured SEM and his own publishing properties, he has driven millions of dollars in incremental pipeline and sales, generated millions of unique visitors, and built, monetized, and sold high-traffic sites. His insights have been featured in outlets including Search Engine Land, Search Engine Journal, USA Today, and Fox Business.