This post was co-written by Gordon Donnelly and Patrick Henry Carrera.
If you’re a reader of the WordStream blog, you may have heard of our Google Ads Benchmarks. Each year, we reach into our giant pool of client data looking for an answer to one persistent, ubiquitous question for PPC advertisers: What exactly does “average” performance look like?
Understanding average performance is key to determining the performance of your account. If you’re leveraging Google Ads as part of your online advertising strategy, what benchmarks should you be looking to surpass? Are your CPCs lagging behind the competition, or are you actually out in front? Does your monthly budget align with your industry competitors, or could that be holding you back?
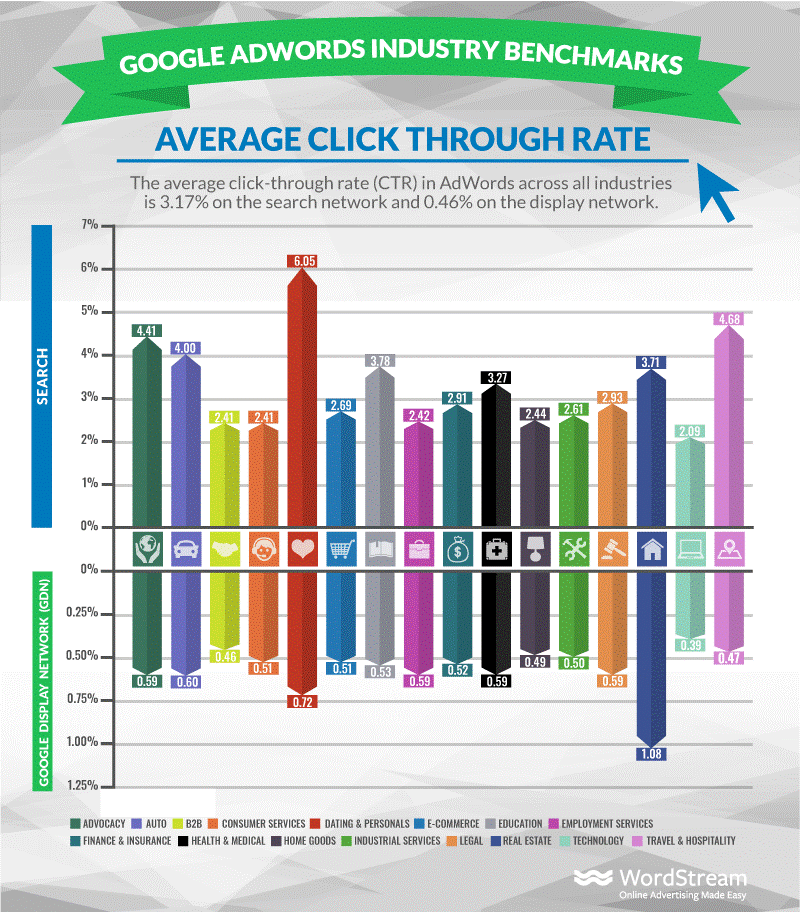
Last year’s Average CTR Google Ads Benchmark.
This year, like last year, we dug into the data to pull the following metrics:
- Average Click-Through Rate (CTR) in Google Ads by industry, for both Search and Display
- Average Cost per Click (CPC) in Google Ads by industry, for both Search and Display
- Average Conversion Rate (CVR) in Google Ads by industry, for both Search and Display
- Average Cost per Action (CPA) in Google Ads by industry, for both Search and Display
And to give you, our readers, the numbers to help you measure performance against competitors in your specific niche, we pulled benchmarks across 16 different industries: Apparel, Arts & Entertainment, Business & Industrial, Computers & Computer Electronics, Dining and Nightlife, Finance, Health, Hobbies and Leisure, Home and Garden, Jobs & Education, Law & Government, Real Estate, Retailers & General stores, Sports & Fitness, Travel & Tourism, and Vehicles.
Now, the official release of the 2019 Google Ads Benchmarks is still a few weeks away. But we’re giving you a sneak peek at how some of the data turned out. Today, we’re getting started with three of the top data-backed insights from this year’s Google Ads Benchmarks.
1. Search seems to be a more cost-effective channel than Display
While CPC is lower in aggregate across Display than Search, Search boasts, on average, the higher CVR, higher CTR, and lower CPA. That means that advertisers leveraging the Display network are going to see less obvious, bottom line value from that channel than from Search—prospects click through more often, convert more often, and convert for less money on average.
Now, on some level, that is to be expected. Display is typically a brand awareness play—advertisers use it to fill the top of their sales funnels with cheap clicks in order to establish contact with net new prospects and build higher intent audiences.

Capturing passive intent on the display network.
But how, in the absence of metrics that reflect tangible business value—CVR, CPA, ROAS (Return on Ad Spend)—is an advertiser meant to demonstrate the value of Display as a channel? Clients looking to generate awareness for new brands might be content with low CPMs and CPCs as indicators of success; but being able to trace the impact of your Display campaigns on a business’s bottom line is key. And it’s not impossible. It’s simply a matter of attribution.
2. Legal, Finance, and Health top the search CPC charts
Legal has long boasted some of the most expensive keywords on the market, and they topped the CPC charts in last year’s benchmarks at $6.75.
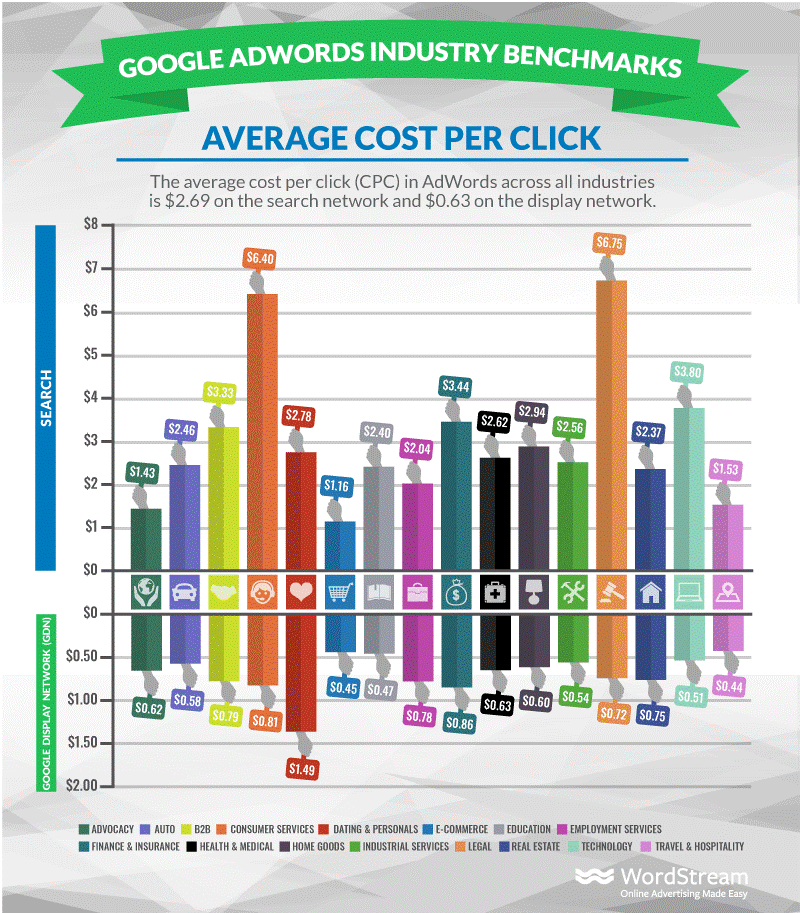
That mark dropped off ever so slightly this year, but Legal still boasted, on average, the highest CPC of all the verticals we measured. It was followed closely behind by Finance, Health, and Home & Garden.
If you’re advertising in one of these niches, don’t despair over high CPCs. High CPCs stem from high search volumes and high competition—and high competition is not a bad thing. In fact, it’s often a good thing—high competition means that the keyword you’re bidding on is valuable. Plus, if you’re in a niche like Legal, you may also find that conversion rates are high, and that your ability to convert at a high rate mitigates the cost you’re paying per click.
Still, it can be a little unsettling having to pay over $5 per click, regardless of your ability to convert.
3. Computers, Legal, and Real Estate boast the highest CPAs
Speaking of expensive—Legal also boasts the second highest CPA of all the niches we measured. Computers and Computer Electronics came in at most expensive with a CPA of over $100(!), while Real Estate ranked third behind Legal.
Like high CPCs, high CPAs are not intrinsically a bad thing. Generally speaking, the more competitive your niche is, and the more difficult it is to convert people, the higher your CPA will be. So don’t sweat it if you have a high CPA—you’ll most likely find that you’re in the same boat as your competitors. That said, there is a foolproof way to lower your CPA and actually beat your competition, and that’s to increase your Quality Score.
Stay tuned!
These data-backed insights should help you understand where you stack up against the competition. But we’ve given you the very tip of the iceberg here—if you want to truly see how you stack up against your competitors, check back to see our full reveal for the 2019 benchmarks soon!

Meet The Author
Gordon Donnelly
Gordon Donnelly is the founder of Powerplay. He is passionate about using AI, automation, and behavioral data to help B2B teams engineer repeatable pipelines and drive revenue. When he’s not helping startups go-to-market, you can find him hanging out in the lineup at Venice Breakwater.