Math was always my favorite subject in elementary and middle school. In high school, outside of the classroom, I started playing fantasy sports, spending waaaaay too much time evaluating stats and matchups while things like Billy Beane’s sabermetrics were developing and becoming more commonplace. Today, my colleagues know that I’m (maybe annoyingly) as likely to talk marketing strategy with my clients as I am to talk data. While everyone may not be quite as enthusiastic as I am, nowadays I’m certainly not alone in how frequently I look at numbers and data.
Marketers live and breathe in a competitive world dominated by data. In paid search, we’re constantly working on improving prominent metrics, such as Quality Score, click-through rate, or cost per conversion. But often, we become focused on simple, core metrics and don’t take a look at the bigger picture.
Return on ad spend, or ROAS, however, does provide a look at the bigger picture. This metric offers greater insight into not only what’s leading to conversions, but also the amount of revenue our conversion actions are generating.
Here’s what you’ll walk away knowing by the time you’re done reading this post:
- The meaning of ROAS for digital marketers
- How to calculate ROAS with a simple formula
- Why ROAS is superior to CPA
- How to use conversion value to calculate ROAS
- How to optimize your Google Ads account for ROAS
What is ROAS?
ROAS stands for return on ad spend—a marketing metric that measures the amount of revenue your business earns for each dollar it spends on advertising. For all intents and purposes, ROAS is practically the same as another metric you’re probably familiar with: return on investment, or ROI. In this case, the money you’re spending on digital advertising is the investment on which you’re tracking returns.
At the most basic level, ROAS measures the effectiveness of your advertising efforts; the more effectively your advertising messages connect with your prospects, the more revenue you’ll earn from each dollar of ad spend. The higher your ROAS, the better.
If you’re so inclined, you can measure ROAS at a variety of levels within your Google Ads account: the account level, the campaign level, the ad group level, and so on. As long as you know how much you’re spending and earning at that particular level, you can calculate ROAS.
How to calculate ROAS: A simple return on ad spend formula
Because ROAS is such an important and powerful metric, you may assume that it’s a hassle to calculate. Luckily, the opposite is true: The ROAS formula is incredibly simple. ROAS equals your total conversion value divided by your advertising costs.
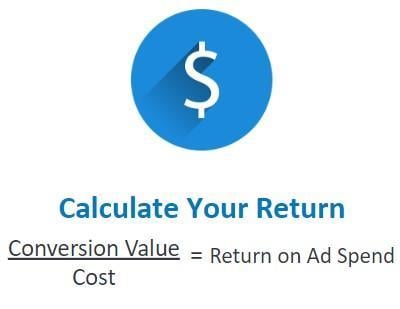
“Conversion value” measures the amount of revenue your business earns from a given conversion. If it costs you $20 in ad spend to sell one unit of a $100 product, your ROAS is 5—for each dollar you spend on advertising, you earn $5 back.
Why ROAS is superior to CPA
Not all conversions are created equal. It’s up to us as marketers to create appropriate conversion actions that show accurate successes in our advertising efforts. A common metric used to determine the success of a paid search campaign is CPA, or cost per conversion. While very useful for measuring volume of conversions, it only measures the average cost associated with any one, single action.
Let’s take a look at two ad groups below.
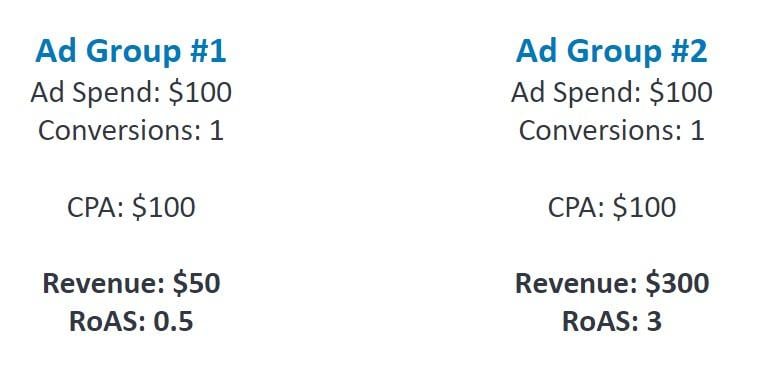
Each ad group spent $100 and accrued one conversion, giving us identical costs per conversion of $100. When we evaluate the value of each conversion, though, we see a different picture. We see one ad group generated $50 from that $100 spent and the other generated $300, giving us a ROAS 0.5 and 3.0, respectively—a significant difference in return for the same amount spent! Achieving a ROAS of less than one is a losing effort, as you’re earning less than $1 for every $1 spent. The ROAS of 3.0 is showing that for every $1 we spent on ads in that ad group, we earned $3 back from that conversion (a 200% return).
In a profit-focused strategy, the goal is to achieve as high of a ROAS as possible. Profit margin will differ by industry, but common benchmarks fall between a 3.0 to 4.0 ROAS, so our goal is to meet and exceed these benchmarks.
How to use conversion value to calculate ROAS
In order to measure ROAS and view this metric in Google Ads, you’ll need to add conversion values to your conversion actions. Setting up tracking with conversion values can be achieved with a flat value for each action or a dynamic amount tied to a unique transaction. If you’re advertising for an ecommerce business, setting up dynamic conversion values is often a straightforward process. Many modern shopping cart platforms have a streamlined process to include the transaction-specific value to each conversion action and require just a bit of modification in the code on your website.
If you’re not in ecommerce and can’t take advantage of transaction-specific values, such as most lead generation campaigns, a more manual or flat calculation would be required.

In this instance, you’d want to take into consideration post-conversion metrics, such as the rate of you or your sales team turning a lead into an actual customer, as well as the average monetary value that customer generates.
For a hypothetical example, let’s say that you do lead gen and that you close 10% of all new leads. If each of these leads creates $5,000 of value, then you would multiply the value per customer by the lead/customer close rate and get a value of $500. In this scenario, a $500 CPA would lead to a ROAS of 1.0; a $250 CPA would lead to a ROAS of 2.0; a $166.67 CPA would lead to a ROAS of 3.0 … I think you all get the pattern. Now that you’ve figured out this conversion value, instead of editing code on your site to create a dynamic, conversion-specific value like you would with e-commerce conversion actions, you can assign a flat value to a specific lead generation conversion action, such as a form fill. This will prompt Google Ads to provide a ROAS for your campaigns.
How to optimize your Google Ads account for ROAS
Now that conversion values have been assigned, you can begin optimizing your account! When evaluating your campaigns, you should analyze a sufficient volume of data before deciding how to split out campaigns and/or ad groups. This typically means at least 100 clicks per campaign, though with any seasonality or short-term changes, you may want to have a larger data set for evaluating performance.
As we’ve discussed before, your account and campaigns should be segmented based on a specific offering or close group of offerings. Whether it’s a Search or Shopping campaign, these campaigns should have products and services split out in a way that you are able to achieve a good balance of volume and return.
Let’s take a look at the account below.
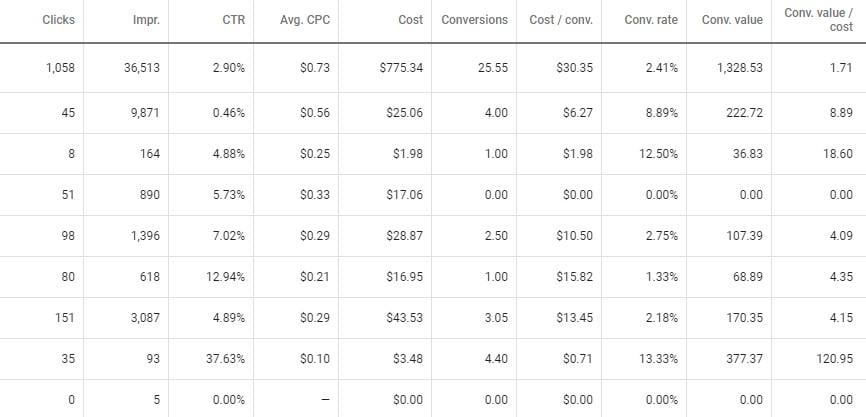
The campaign with the highest spend does have the highest volume of conversions, but it also has the lowest ROAS of any campaign with impactful spend. In this scenario, this advertiser should be diving into the campaign with the larger spend and looking at what’s actually working:
- Keywords with high spend and no conversions
- Search terms that lead to conversions
- Negative keywords that don’t make sense for your business
- Budget monopolization—an ad group, keyword, or related set of keywords using a lot of the budget with lower return
Often, bidding on search queries that have sales-related context or intent, i.e., “buy,” “shop,” “online,” “sale,” or “cheap,” can result in a higher conversion rate even on these results, even if their shorter-tail keywords without this context results would lead to a higher search volume. Greater context or intent in your keywords can be a huge plus!
With this particular account, we’d want to split out a larger, higher-spending, more general campaign into more segmented campaigns or ad groups that are both more specific and contextual and actually lead to better return!
Are you maximizing your Google Ads ROI?
Find out instantly with the Free Google Ads Performance Grader.
Because the other, lower-spend campaigns have already been split out into their own respective subsets that lead to stronger returns, the goal would be to continue working on optimizing that larger, less-efficient campaign based on some of the key strategies above. In your own account, continue to review your impression share to ensure that these new, more efficient campaigns aren’t missing out on clicks due to inflated budgets of less efficient campaigns.
Now, I’m going get a bit granular—stay with me.
There’s more than just evaluating search queries and daily budgets that can be used to optimize your account. Continue by thinking of your target audience, and review your metrics across demographics. Do your customers tend to make multiple visits to your site before taking action? Add website visitors as an audience with observation, and include a positive bid modifier. Do your customers make repeat purchases? Add a customer list audience with observation again with a positive bid modifier. You may even look to create entirely separate RLSA campaigns using audience targeting instead of observation!
Tip: Review your attribution model
There are multiple options for attributing conversions beyond the default Last Click attribution model, including single-touch and multi-touch models, each giving you a different way to evaluate what’s truly influencing your conversions.
Branded campaigns, for instance, often have a high ROAS, as a customer may have finally decided to buy your product or inquire about your service, and they quickly searched your brand name before completing your tracked conversion action. You might be missing out on what helped bring that customer to your website before they searched for your brand. Maybe a more general, top-of-funnel search is leading to many first clicks for a future customer—and you never knew it! Those keywords may actually be more valuable than they originally appeared with last click so it’s best to view different models.
If you offer a product or service that has a longer sales cycle, a multi-touch attribution model with a longer conversion windows can provide greater insight as to what keywords are influencing conversions, as partial conversion numbers will accrue. Learn all about multi-touch attribution here.
ROAS & Google Shopping campaigns
Shopping campaigns are a bit different from search campaigns, since there are no keywords, instead using a product feed ideally. With proper segmentation of the product feed into different campaigns and ad groups, using exclusions for product that don’t fit into the appropriate campaign/ad group, you can structure Shopping campaigns to optimize for ROAS, even using a Target ROAS bidding strategy if you have sufficient conversion volume.
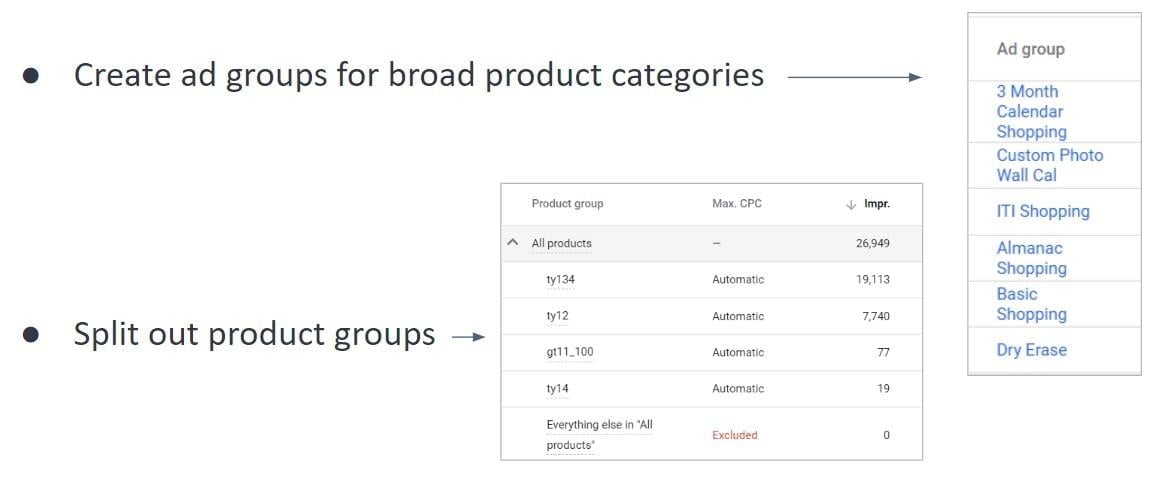
Additionally, like with the search campaigns we looked at above, shopping campaigns can similarly use negatives to filter out poor search queries and be structured in a way that leads to stronger ROAS.
Shopping campaigns use images from your product feed and can appear more prominent than text ads, have a strong conversion rate, and tend to have lower costs per click than text ads, as well. Because of this, they can be consistent sources of conversions with a great ROAS if you’ve structured your campaigns well!
Next, review your account
If I haven’t bored to death on math, numbers, and revenue, then I hope you start preparing to take a deeper look at your account with revenue and profit in mind. ROAS doesn’t need to be seen as simply an e-commerce metric. Lead generation and ecommerce marketers alike can use this metric to make smart, profitable decisions for their account.
As the examples I provided above often refer to benchmarks, it’s important to review your own products and services to determine an appropriate margin to use when figuring out what a necessary ROAS needs to be for your conversion actions and campaigns.
After reading this, you should have a solid understanding of what ROAS data tells you about your account and how to best take action to optimize. Goals may differ across your different campaigns, but the end goals remain the same: increasing your profits and allowing you to grow your business.


