I recently learned six Google Analytics tips that literally changed the way I use the software. Until just last week, I only used Google Analytics casually. I’d log in, poke around a little bit, then leave with only a vague idea of what was going on with our traffic. In other words, I was barely scratching the surface of what was possible.

We recently did an all-day intensive Google Analytics training session, which showed me a ton of features that I wasn’t using and didn’t even know about.
Before the training, I was pretty much just using Google Analytics to check daily and weekly blog traffic trends. However, the features I’m going to share with you allow me to see:
- Detailed visitor demographic data and how the behavior of certain types of users can be tracked against “typical” visitors
- How our traffic aligns with our goals, and how visitors actually progress through our goal funnels
- Our conversion paths, and the (often convoluted) route that visitors take from first action to conversion
- Unusual traffic patterns and the underlying reasons for sudden shifts
- How traffic trends compare to previous time periods
In this post, I’ll pass that knowledge on to you! Here are six Google Analytics tips you need to know about – right now.
1. Use Audience Data When Creating Custom Visitor Segments
Hopefully, you’re already using custom segments to classify your visitors by various demographic data, such as age, gender, and location. However, if you’re not drawing on the data in the Audience reporting views to help you create your custom visitor segments, you’re missing out on a wealth of information about how specific users are interacting with your site. Needless to say, I had no idea I could even do this until recently, which is what makes the first of my Google Analytics tips my personal favorite.
First, navigate to the Interests Overview within the Audience reporting section (Audience > Interests > Overview). This will present you with a broad view of the other three Interests reports: Affinity Categories, In-Market Segments and Other Categories, as seen in the figure below.
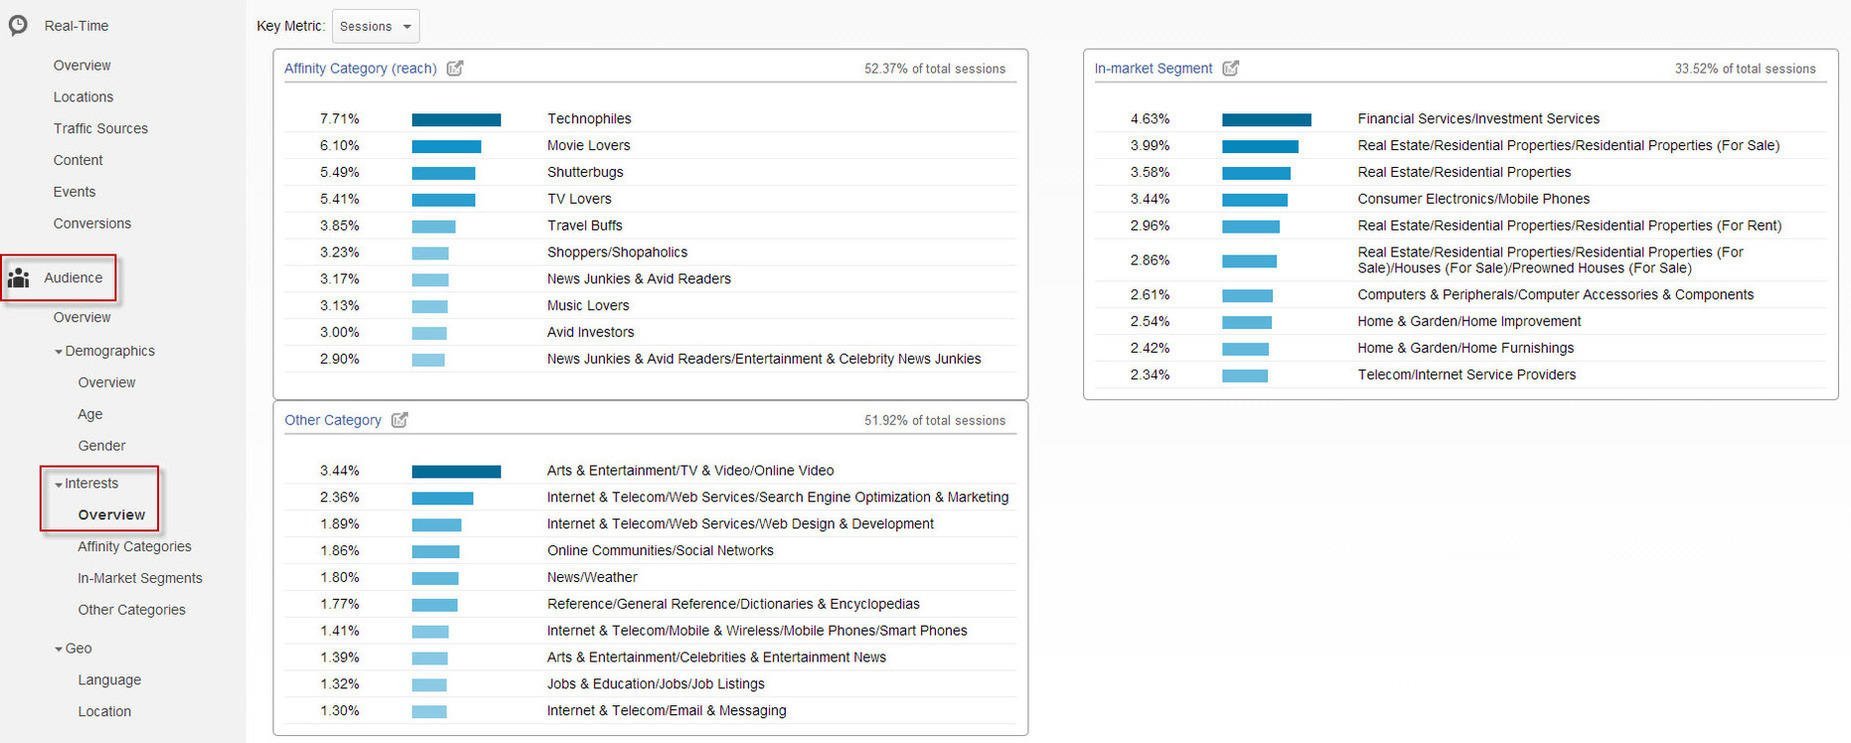
Based on this data, we know that almost 8% of visitors across all sessions are identified as “technophiles” – individuals with a strong interest in technology. We can also see that almost 5% of visitors in the In-Market Segment either work or are interested in Financial/Investment Services.
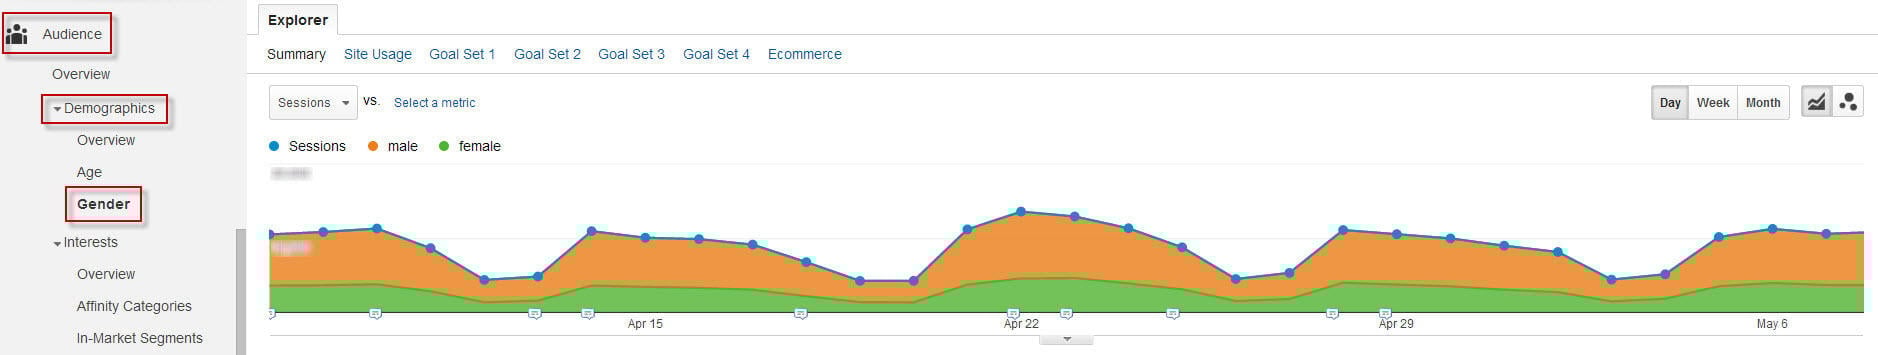
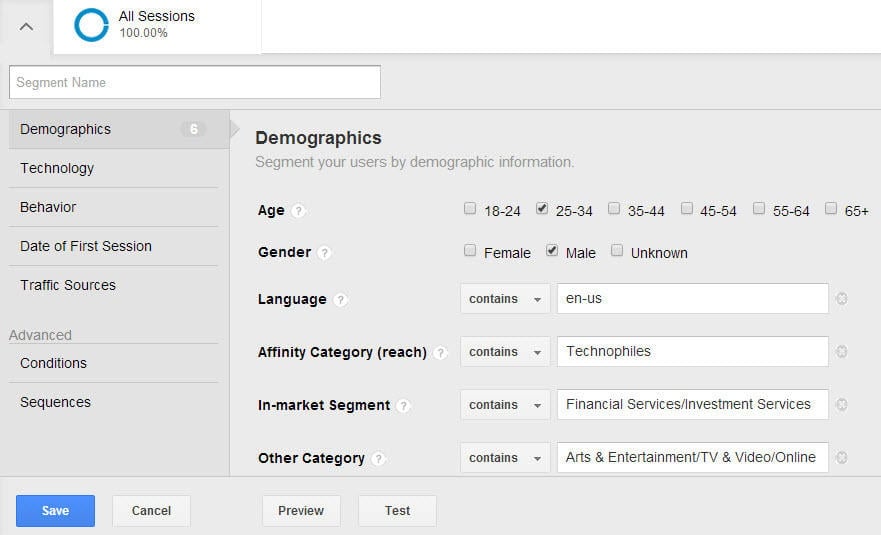
We’re starting to get a better idea of who our typical visitor is, but we’re going to go deeper before we create our custom segment. Next, we’re going to look at Age and Gender data by selecting these reports from the Demographics section of the Audience reports (Audience > Demographics):
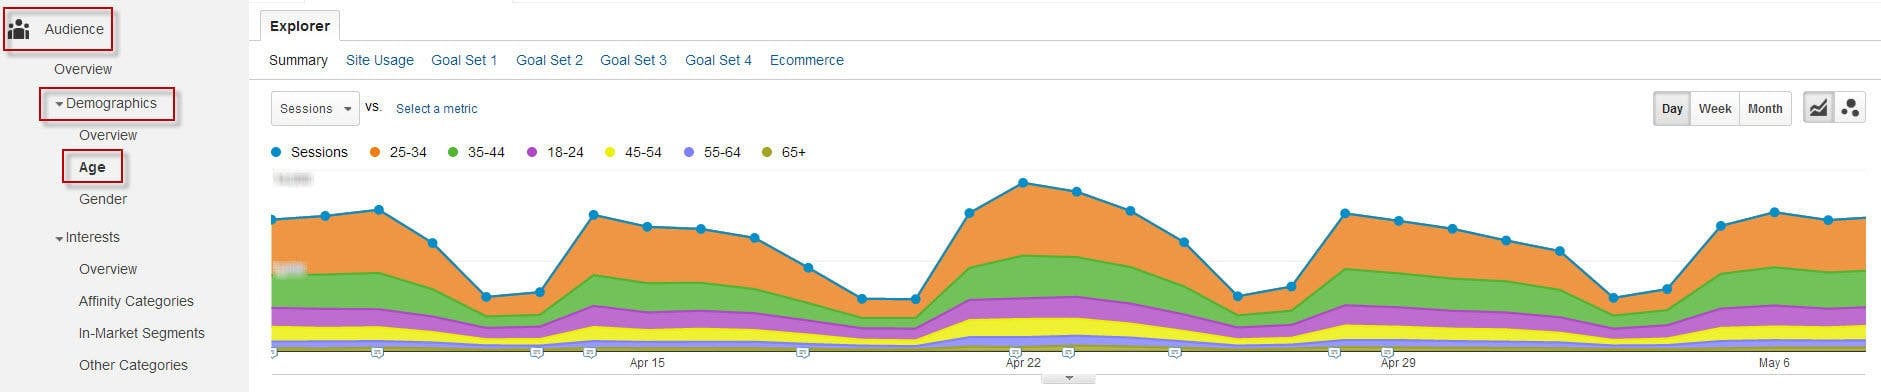
This data tells us that a majority of our visitors are between the ages of 25-34, and the graph below shows that many more men visit our site than women (not exactly surprising, considering the gender bias in search):
So, after a little digging, we know that many of our visitors are:
- Male
- 25-34 years old
- Have a strong interest in technology
- Work in financial or investment services
How to Create Custom Segments in Google Analytics
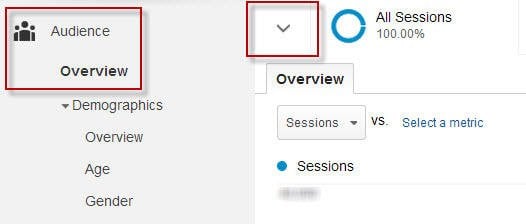
Armed with this data, we can create a custom visitor segment that we can track against goals (more on this shortly). To do this, we need to go back to Audience reporting and click on the downward-facing chevron to the left of “All Sessions”:
Next, we’ll create our custom segment based on the demographic data above. For the sake of this example, we’ll also include data from the Other Category report within Interests Overview, which in our case, was Arts & Entertainment/TV & Video/Online Video:
Now all you have to do is name your custom segment and save it. Alternatively, you can test this advanced custom segment to get a better idea of how many visitors fall within these parameters.
This segment can now be measured against other visitor traffic to gain insight into how certain types of visitors behave in comparison to one another, rather than forcing you to make do with a broad overview of all pageviews or sessions.
It’s worth noting that depending on your sampling size, specified date range and the number of advanced segments you’re already using, this process can take a while (or even fail outright), so you might have to go back and make some adjustments before your custom segment will save correctly.
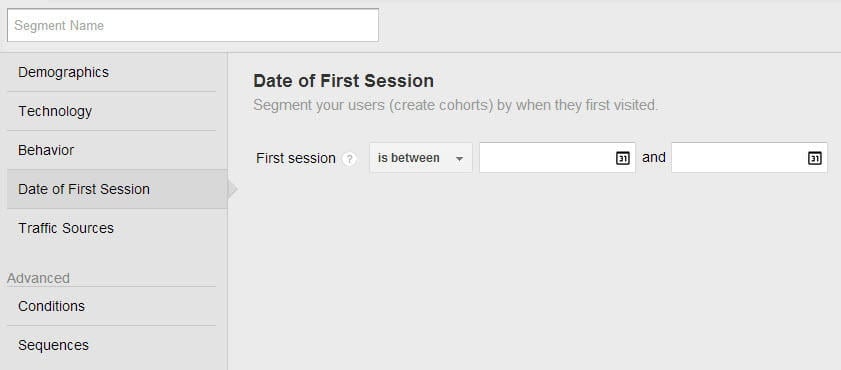
BONUS GOOGLE ANALYTICS TIP: Once you’ve created your custom segment, you can further refine it by including the date of these visitors’ first session by specific date range. This cool feature was only introduced within the past month or so, and it allows you to further refine how you track certain visitors. This can be incredibly useful for remarketing campaigns.
2. Assign a Monetary Value to Goals
The second of my Google Analytics tips relates to goals. You should definitely be setting goals in Google Analytics. If you aren’t, you’re basically just looking at relatively useless metrics such as pageviews and time on site. However, you shouldn’t just be setting goals – you should also be assigning them a monetary value.
Let’s take a look at a sample Goal Flow report from WordStream’s Google Analytics account.

As you can see, it’s pretty straightforward. For this particular goal, we get a majority of our traffic from Google, with strong direct traffic coming in as our second-largest source. If you’re unfamiliar with Goal Flow reports, the red areas to the right of the second and third stages of the goal funnel steps are known as “funnel exits” – visitors who failed to perform the action we want them to at a given stage, which is to sign up for a free trial in this example.
So, why should you assign a monetary value to your Goal Flow? Because until you assign a monetary value to your goal flow, it’s impossible to gauge how much money you’re losing on every lost lead that exits the funnel.
Ever notice the “Page Value” metric in your traffic score card? This is where you’ll see the financial value of a page in relation to its goal value and the position it occupies in your conversion paths. If you haven’t assigned a value to your goals, these values will be zero.
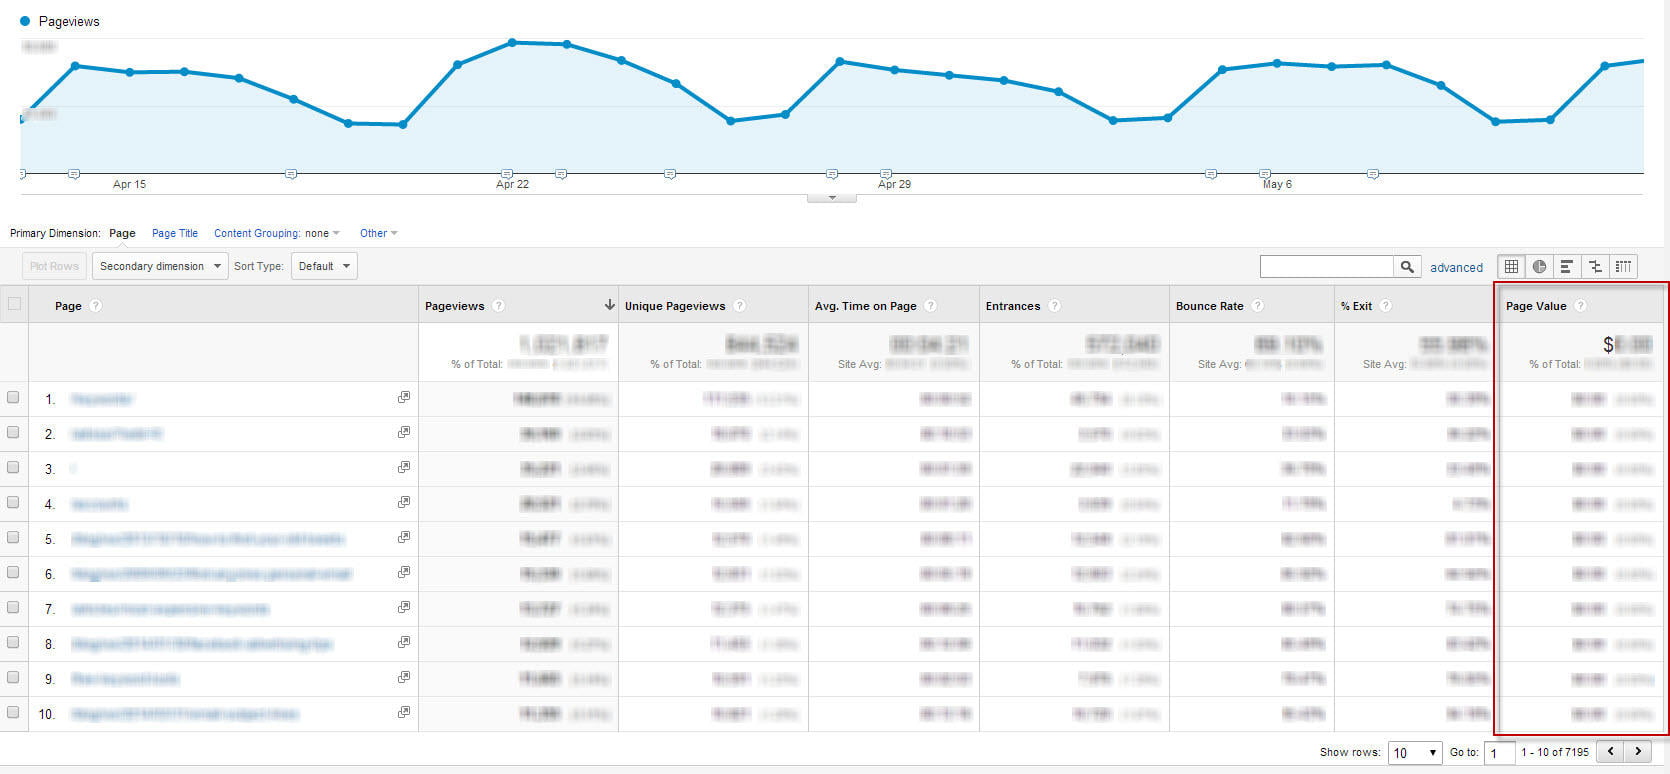
Let’s say you assign a goal a value of $25. It’s important to note that the values displayed in this column won’t just be $25 or $0 – the page’s role in assisted conversions is also weighted in the Page Value column, meaning these values will vary depending on the page in question and its role in one or more conversion paths.
How to Assign Values to Goals in Google Analytics
To assign a value to a goal, navigate to the Admin section of Google Analytics (accessible from the top menu) and click “Goals”:
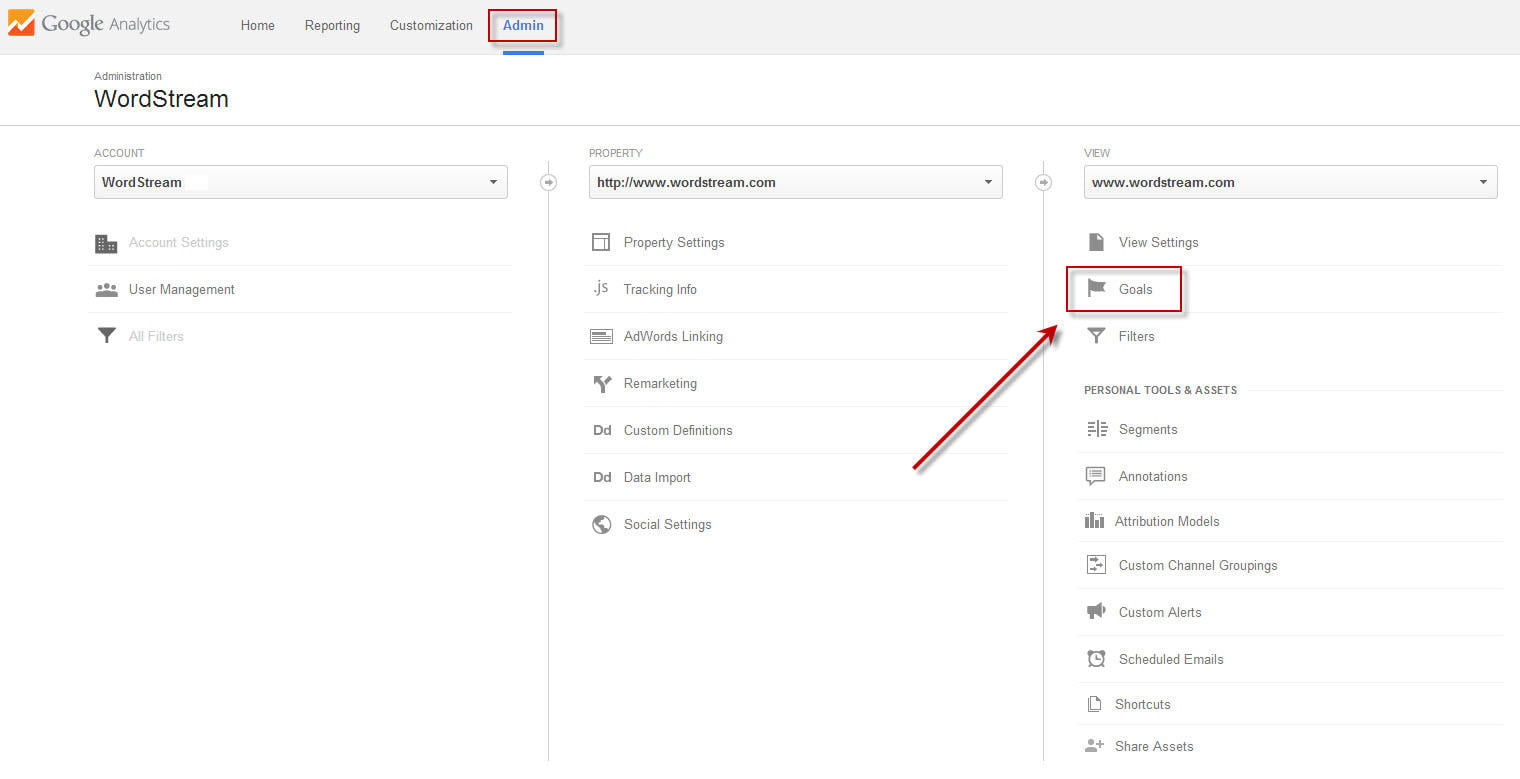
You’ll now be presented with a list of your goals. When you click on one, you’ll see an interface within which you can specify the monetary value you want to assign to the goal.
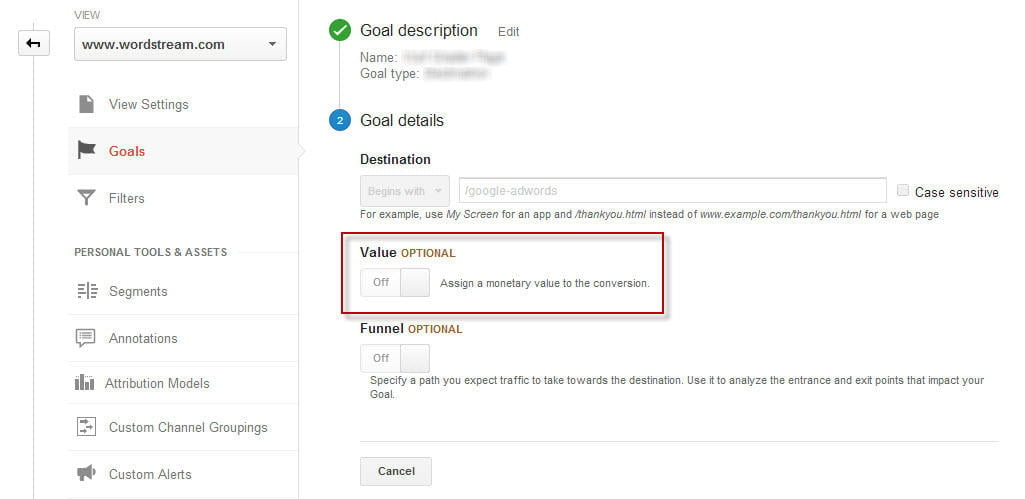
The precise value of a goal will vary depending on several factors, but it’s generally advisable to underestimate how much a goal is worth. Until you get a better idea of what each conversion is worth to you in financial terms, stick to a lowball estimate.
By estimating the worth of a lead, and assigning this value to each goal, you can start to see (in real financial terms) how much money you could be losing with your existing goal flow. This could, in turn, prompt you to start thinking about whether your goal funnel is optimized enough. Do you need to add more steps? Provide additional navigation to enable users to revisit previous sections of the funnel more easily? Remove something simple that’s harming your conversion rate? These are all questions that could arise from placing a dollar value on each goal.
3. Examine Your Top Conversion Paths
Unfortunately, visitors to your site don’t always behave the way you want them to. Wouldn’t it be wonderful if prospective customers saw your ads, visited your site and ultimately made a purchase – all in a single sitting? Well, it rarely works like that, which is why understanding your conversion paths is so important – especially in today’s advertising landscape, where people rarely complete a purchase on one device, never mind in one session.

Image © Peter Andrew
In addition to illustrating how your visitors are actually converting (as opposed to how you think they’re converting), examining your top conversion paths in Google Analytics provides a fascinating glimpse into user behavior – and the often-complex route many visitors take from first action to the ultimate conversion.
How to Examine Conversion Paths in Google Analytics
To look at these visitor journeys, go to the Top Conversion Paths section of the Conversions reports (Conversions > Multi-Channel Funnels > Top Conversion Paths). Here, you’ll see the top 10 conversion paths by default, with options to extend the number of rows being displayed.
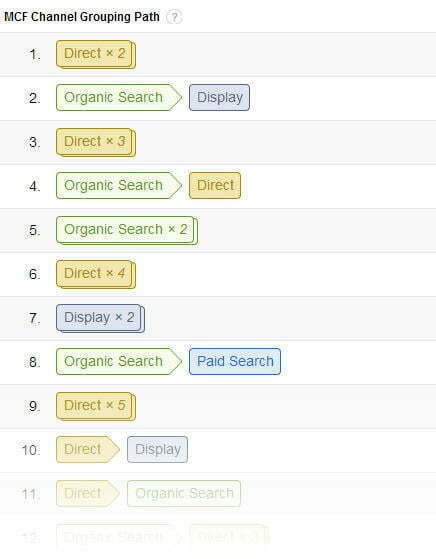
In this example, you can see that the most effective conversion paths are pretty standard (two direct visits, an organic search leading to a display ad, three direct visits etc.), but some other conversion paths are a little more unorthodox. Two display ads? A direct search leading to a display ad? Two organic searches?
You also have the option to display the top conversion paths by MCF Channel Grouping Path and map these results against Keyword (Or Source/Medium) Path, which can reveal additional insights into how each of your channels is working:
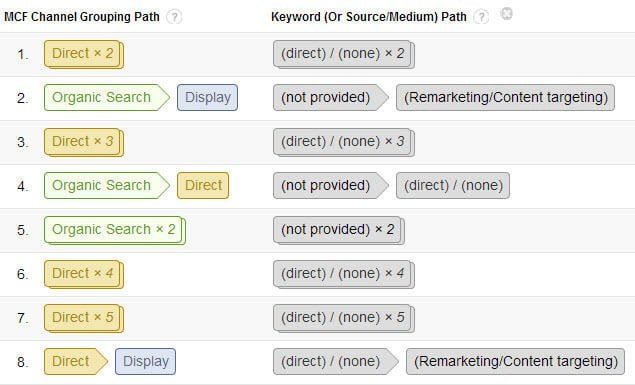
Damn you, (not provided)!
4. Set Up Intelligence Events
It’s important to keep a close eye on your site’s performance on a regular basis, but chances are good that you won’t see huge deviations from one day to the next. What about those weird anomalies that make you do a double-take, though? Those huge spikes (or drops) in traffic that defy explanation? This is when Intelligence Events come into play.
Intelligence Events is a feature in Google Analytics that allows you to set custom parameters to monitor for unusual site activity and send alerts to designated account managers. For example, a 200% increase in traffic on a given day would be considered unusual, and as such Google Analytics would record the data surrounding this event and alert you to it.
Now, you might think that you’d notice such a large increase in traffic to your website purely by monitoring your usual metrics, but this might not necessarily be the case. Let’s take a look at a recent example we came across.
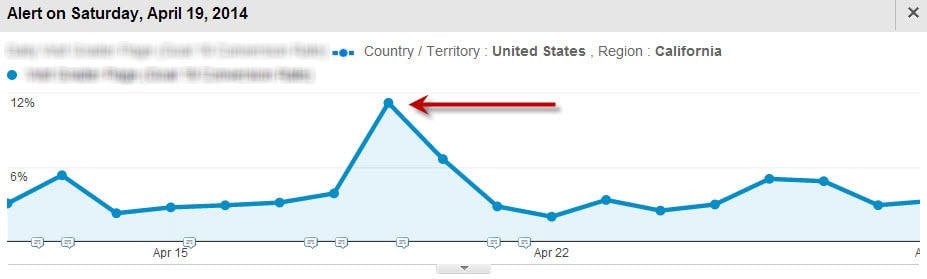
On Saturday, April 19, we received an Intelligence Event alert that notified us of a 216% increase in traffic to a specific page. The alert also provided us with data about the origin of much of the traffic (in this case, California), as well as the associated metric (one of our conversion goals). This kind of a spike should stick out like a sore thumb, right? That’s what we thought. However, we were wrong.
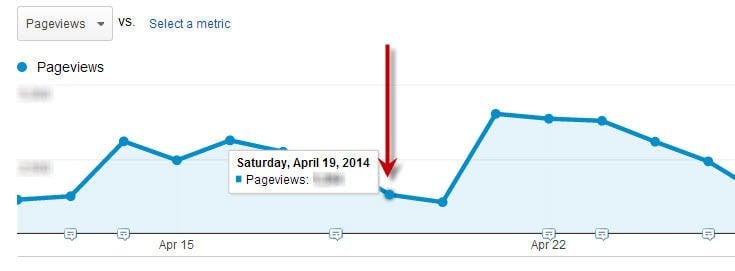
As you can see in the figure above, overall traffic for that day seemed low – certainly nothing out of the ordinary for a Saturday, when our traffic tends to trend lower than weekdays. Had we relied on a cursory glance of our Pageviews report, we would have had no idea that we received more than 200% more traffic to that page, and this spike would have slipped under the radar completely unnoticed.
How to Set Up Custom Intelligence Event Notifications in Google Analytics
By default, Google Analytics will notify you of unusual site activity – including the type of anomaly in the example above. However, don’t rely on Google to tell you when something important happens. Instead, set up your own Intelligence Events.
First, open the Intelligence Events reporting section, and select the “Custom Alerts” tab from the menu on the right. Then, select “Manage Custom Alerts.”
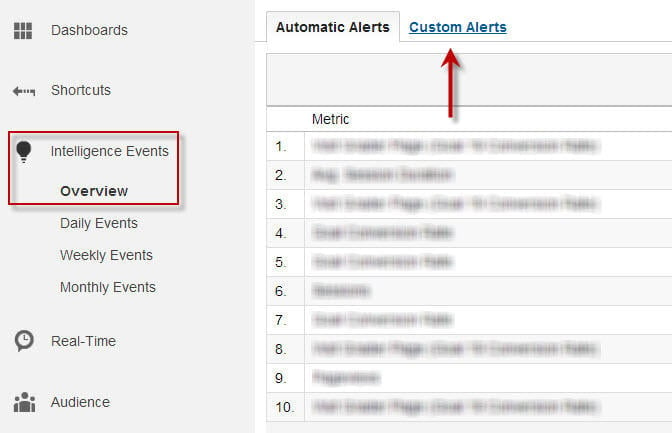
Next, click the red button labeled “+ New Alert.” This will present you with the interface where you’ll create your custom Intelligence Events.

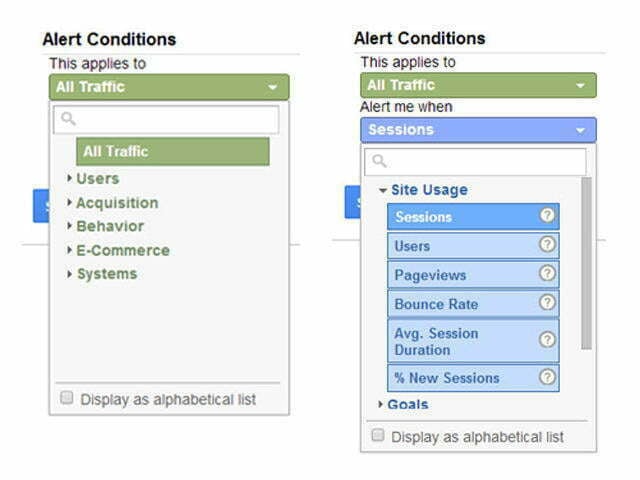
Here, you’ll specify a range of parameters that will trigger custom Intelligence Events notifications. As you can see, you can customize the views to which the alert conditions will apply, the time period, and how notifications are sent – either by email (to one or more specified addresses) or email and SMS text alerts (note that SMS alerts are only available to Google Analytics users with United States-based cell numbers).
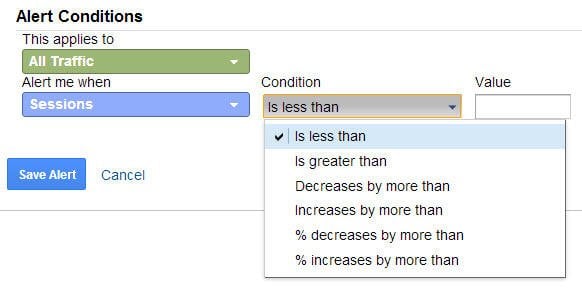
Next, you need to state what conditions must be met for the alert to be triggered. First, set the traffic conditions and the site usage parameters (images condensed for illustrative purposes):
Next, set the general conditions that must be met from the drop-down menu to the right:
Now, simply name your custom alert, save it, and you’re all done!
5. Compare Historical Traffic Trends
Many Google Analytics users only concern themselves with current traffic trends, but identifying patterns based on previous traffic can yield valuable insights into how traffic can change over time. One of the best ways to investigate this data is by using the Compare to Previous Period tool in the date range dialog box:
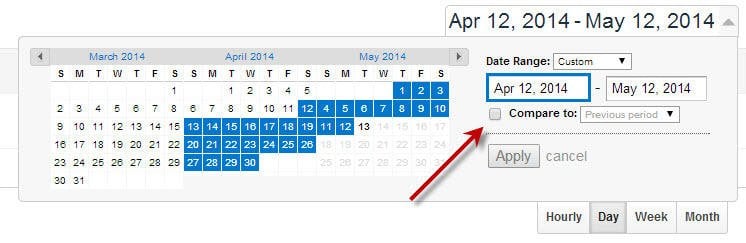
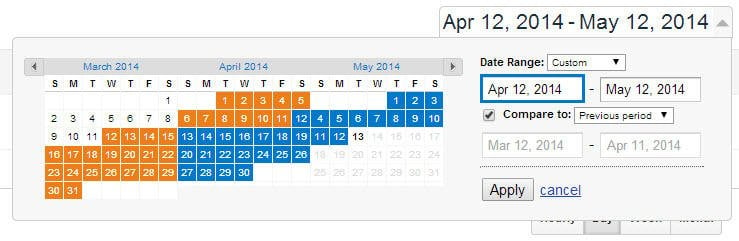
Once you’ve specified the desired date range (and the previous period to compare it to), you can apply this filter to see how your traffic stacks up from one time period to another – in this case, from April 12 to May 12, and March 12 to April 11 (the previous period):
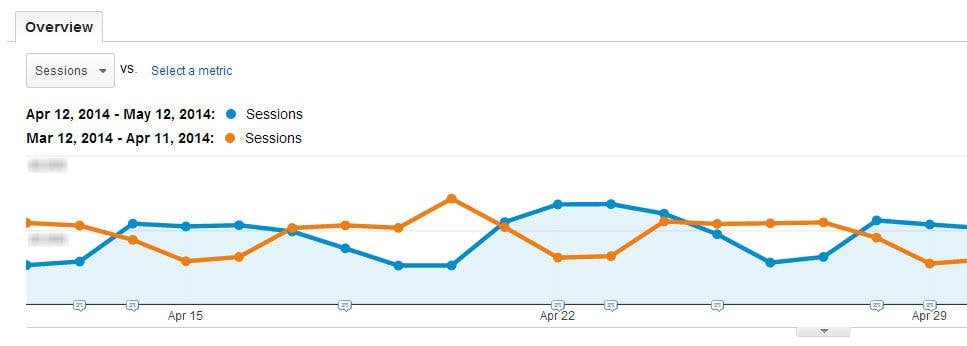
Notice how the valleys of one plotted line (April 12-May 12 in blue) correspond quite closely to the peaks of the second plotted line (March 12-April 11 in orange) and vice versa? This is caused by disparities in the days of the week specified when comparing recent traffic data against a previous date range.
How to Specify Custom Date Ranges in Google Analytics
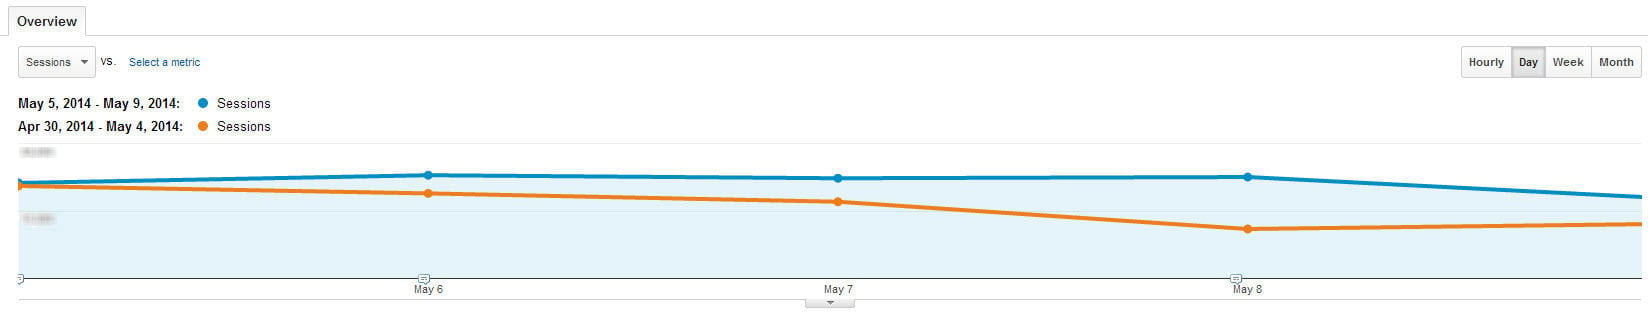
For example, if you were to apply this filter to a weekly view, you might think that a Monday-Sunday week view would mirror the previous period exactly – but it doesn’t. Instead, Google Analytics defaults to the number of days in the specified period, not to the corresponding days of the previous week. Let’s take a look at this in action:
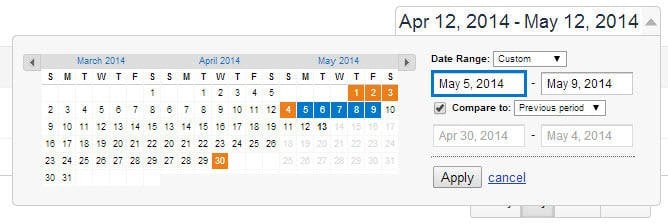
The first date range is Monday, May 5 to Friday, May 9. This spans the full five-day business week for this specified period. However, when we select “Compare to Previous Period,” Google Analytics pulls data from the five-day period immediately preceding the first date range, not the previous five-day work week – meaning the data included in the graph is actually comparing completely different days of the week, resulting in the (misleading) graph below:
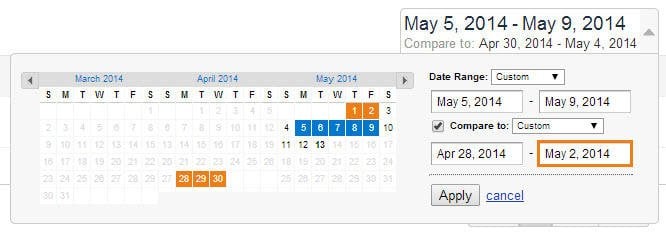
However, if we make sure we specify a custom date range (in which the days of the week match perfectly), we’ll see that the two graphs are virtually identical. Note that to accomplish this, you’ll need to enter the desired date range manually in the relevant fields, rather than clicking on a start day and letting Analytics fill in the blanks:
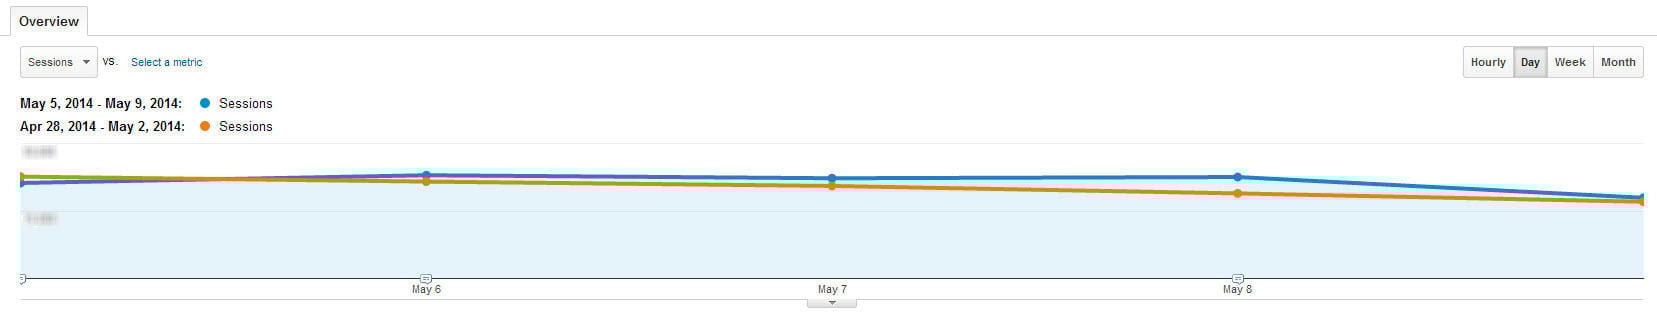
As you can see, there is still some slight variation between the traffic – but nothing out of the ordinary, and certainly nothing like the significant variance we saw in the misleading graph above.
6. Add Annotations to Your Reports
The last (but by no means least) of my Google Analytics tips has to do with good housekeeping. Maybe you’re not the only person responsible for keeping an eye on your Google Analytics account. If this is the case, you’ll need some sort of way to keep tabs on why things happened and when. Was a media mention the reason for a huge spike in traffic? Did a slump coincide with a less-than-successful email campaign? Whatever you need to remember in Analytics, annotations can help.
Annotations are simple notes that can be added to an Analytics reporting graph to explain rises or falls in traffic, make other account managers aware of promotional campaigns that launched on a given day, and just about anything else you want to make note of directly within Analytics.
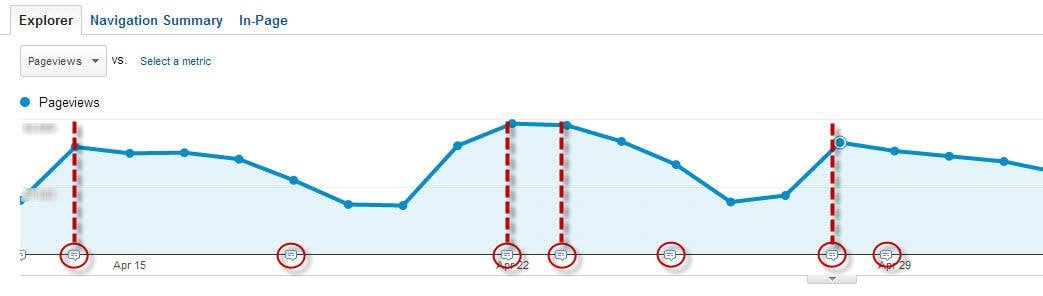
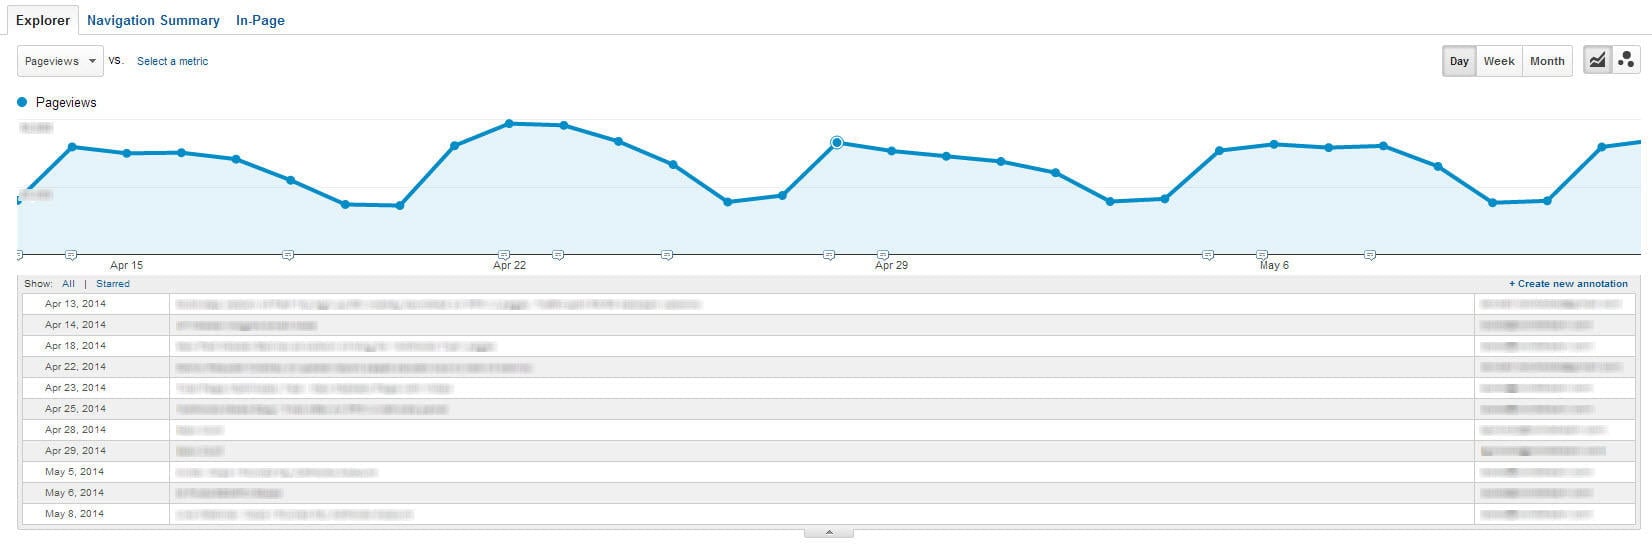
Annotations appear as speech bubble icons along the bottom of an Analytics graph. In the figure above, notice how many of the peaks in our Pageviews graph have accompanying annotations.
How to Add Annotations in Google Analytics
To actually read annotations, simply click on the downward arrow tab icon immediately beneath the graph. You’ll see a list of all annotations made within the specified time period, as well as information about who created the annotation and their email address. Annotations can be set to “Public” or “Private,” allowing you to control who sees what. To create a new annotation, simply click “Create new annotation” on the right above existing annotation authors’ email addresses:
Tame Your Traffic
Whew! That brings us to the end of our top 6 list of Google Analytics tips. If you aren’t already, I’d strongly recommend using these techniques to use your reports to gain greater insight into your traffic, conversion funnel, and how your visitors are behaving on your site.

Meet The Author
Dan Shewan
Originally from the U.K., Dan Shewan is a journalist and web content specialist who now lives and writes in New England. Dan’s work has appeared in a wide range of publications in print and online, including The Guardian, The Daily Beast, Pacific Standard magazine, The Independent, McSweeney’s Internet Tendency, and many other outlets.