With 1.32 billion daily active users, Facebook is the most widely used social platform by quite a bit. Whatever your business goal—brand exposure, website traffic, lead generation—Facebook should, and likely will, make up a sizable part of your marketing strategy in the coming year.
That’s why we decided to put together a list of 75 fascinating and actionable Facebook statistics to keep in mind when you’re revamping your social strategy for 2026. Need help deciding which gender to target? Want to know how much your competitors are spending on Facebook ads? Like a few puppy gifs to keep the mood light? You’re in the right place!
Facebook Usage Statistics
1. As of September 30, 2020, Facebook enjoys 2.74 billion monthly active users.
2. 79% of Americans use Facebook—the platform with the second closest usage percentage is Instagram, at 32%.
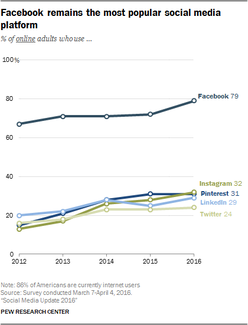
Image via Pew Research Center
3. More than half (53%) of U.S. residents use Facebook “several times a day.”
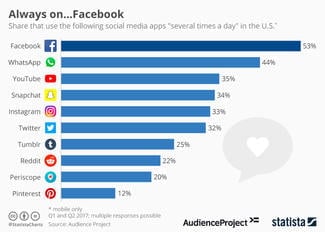
Image via Statista
4. 50 million businesses use Facebook Pages. If you need help getting your business page up and running, our very own Allen Finn put together a useful guide here.
5. 22% of the world’s total population uses Facebook.
6. About 83 million Facebook accounts are bogus, and function either as duplicates, accounts made for things other than people, or accounts made to distribute spam.
7. 400 new users sign up for Facebook every minute.
8. Facebook Messenger has over 1.2 billion monthly active users.

A Facebook message.
If you’re interested in Facebook Messenger ads, we wrote about four different ways to set them up.
9. Users access Facebook an average of eight times per day.
10. Each day, 35 million people update their statuses on Facebook.
Facebook Connectivity Statistics
11. The average Facebook user is separated from another given user by just 3.57 degrees of separation.
12. The average Facebook user has 155 friends, but would trust only four of them in a crisis. Yikes.
13. Facebook users consider, on average, just 28% of their Facebook friends to be genuine or close friends.
14. 83% of parents with a teen between the ages of 13 and 17 are friends with their child on Facebook.
15. 39% of users say they are connected to people they have never met in person.
16. 42% of Facebook customer service responses happen during the first 60 minutes.

17. 36% of users say they are Facebook friends with their neighbors.
18. 58% say they are connected to work colleagues.
19. Facebook is available in 101 languages, and over 300,000 users helped with translation.
Recent languages added using Facebook’s community translation tool (Photo: Facebook)
Life-Affirming Facebook Statistics
Image via Facebook Newsroom
Despite what you read in your Twitter feed this morning, not everything in this world has teeth, and is either trying to eat you or blow you up. Here are some statistics that reflect some of the good Facebook is doing, in your community and elsewhere:
20. More than 100 million Facebook users belong to meaningful communities—groups aimed at helping users such as new parents or victims of rare diseases.
21. Facebook has helped 50% more users join meaningful communities in the past six months.
22. 8.5 million people were marked as safe through Safety Check after the April 2015 earthquake in Nepal.
23. 770 thousand people used Facebook to donate over $17 million in one week following the April 2015 earthquake in Nepal. Facebook itself donated $2 million.
24. 80 million people use Facebook’s stripped down app Facebook Lite for the developing world’s slow connections.
25. In the wake of Hurricane Maria, Facebook donated $1.5 million to NetHope and the World Food Programme, committed ad space to disseminate safety information to people in the region, and deployed a connectivity team to help deliver emergency telecommunications assistance to Puerto Rico.
Facebook Marketing Statistics
26. Thursdays and Fridays between 1 p.m. and 3 p.m. are considered by many to be the best times to post on Facebook.
27. Facebook Pages posts average 2.6% organic reach.
28. Facebook Pages with smaller followings generally have higher reach and engagement rates.
29. Facebook is the “most important” social platform for marketers.

Image via Social Examiner
30. Brands post an average of 8 times per day on Facebook.
31. 57% of consumers say social media influences their shopping, led by Facebook at 44%.
32. User-generated content has been shown to generate 6.9 times the engagement of brand-generated content.
Facebook Advertising Statistics
33. The average click-through rate (CTR) in Facebook ads across all industries is .90%.

34. The industry with the highest click-through rate on Facebook is the legal industry, at 1.61%. The industry with the lowest click-through rate is the employment and job training industry, at 0.47%.
35. The average cost per click (CPC) in Facebook ads across all industries is $1.72.
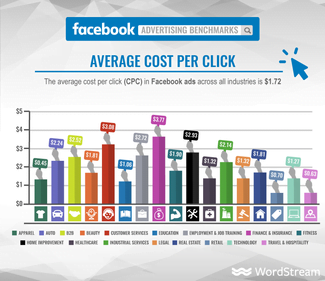
36. The industry with the highest cost per click on Facebook is the finance and insurance industry, at $3.77. The industry with the lowest cost per click is the apparel industry, at $0.45.
37. 93% of social media advertisers use Facebook Ads. The next closest platform is Instagram, at 24%.
38. 20% of Facebook’s mobile ad revenue comes from Instagram.
39. The most effective length for an ad title on Facebook is four words—15 words for a link description.

40. Images account for 75-90% of Facebook Ad performance.
41. Facebook reported advertising revenue of over $54 billion in the first half of 2022.
42. 26% of Facebook users who clicked on ads reported making a purchase.
Facebook Demographic Statistics
43. 83% of women and 75% of men use Facebook.
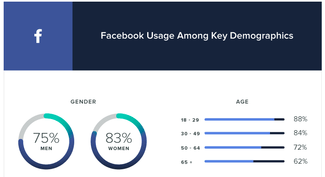
Image via Sprout Social
44. 83% of Facebook users worldwide are under the age of 45.
45. 44% of Facebook users 18 and older identify as women. 56% identify as men.
46. 39% of Facebook users report being married, while another 39% report being single.
47. As of July 2021, men ages 25-34 make up the highest percentage of Facebook users by both age and gender, at nearly 19%.
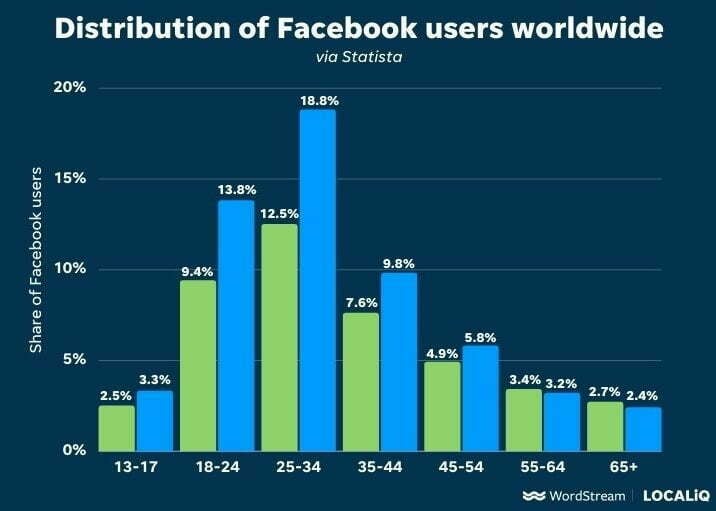
Image via Statista
48. 62% of Facebook users have some form of university education, while 30% report high school as being the highest level of education reached.
49. Almost 85% of Facebook’s daily active users are outside of the U.S and Canada.
50. Behind the U.S., India, Brazil, and Indonesia have the largest audiences on Facebook.
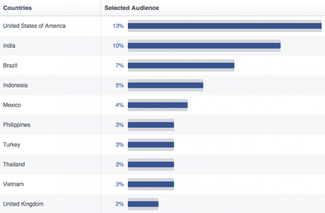
Image via Facebook Business
51. New parents use Facebook mobile 1.3 times more often than users without children.
52. Facebook is the preferred social platform of supermarket shoppers—89% use it.
Facebook Video Statistics
53. Facebook gets over 8 billion average daily video views.
54. 85% of Facebook users watch videos with the sound off.
55. People are 1.5 times more likely to watch video daily on a smartphone than on desktop.
56. 47% of the value of Facebook video ads happens in the first three seconds.

Image via Facebook Business
57. Millennials are 1.35 times more likely than older generations to say they find it easier to focus when watching videos on mobile.
58. One in five Facebook videos is now a live broadcast.
59. In 2020, over 75% of the world’s mobile data traffic is video.
60. Videos earn the highest engagement rate, despite making up only 3% of content.
61. 85% of Facebook videos are watched with the sound off.
RELATED: 165 Strategy-Changing Digital Marketing Statistics
Facebook Mobile Statistics
62. In Facebook News Feed, people consume a given piece of content faster on mobile than on desktop.
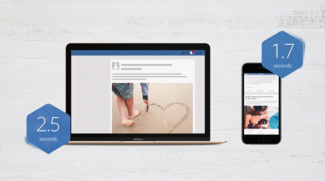
Image via Facebook IQ
63. People can recall a piece of consumed mobile content for just 0.25 seconds.
64. Mobile makes up around 87% of Facebook’s overall ad revenue.
65. 19% of time spent on mobile devices occurs on Facebook.

Image via Flurry Analytics
66. 47% of Facebook users exclusively access the platform through mobile.
67. Facebook claimed 19% of the $70 billion spent on mobile advertising worldwide in 2015.
Facebook Fun Facts
68. As of December 2020, Facebook has more than 58,000 employees.
69. Shakira has the most Facebook fans of any musician on Facebook.
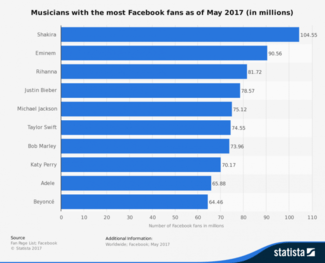
These stats don’t lie.
70. Over 2.5 trillion posts have been created on Facebook.
71. Facebook Reactions have been used more than 300 billion times since they launched in February 2016.
72. Given that each video gets approximately 3 seconds per view, Facebook generates over 3,000 years of video watch time each day.
73. 42% of Facebook fans “like” a page with designs of getting a coupon or discount.
74. Facebook users generate 4 million likes every minute.
Have an updated marketing stat you’d like to share? Tweet @WordStream or leave us a comment below!

Meet The Author
Gordon Donnelly
Gordon Donnelly is the founder of Powerplay. He is passionate about using AI, automation, and behavioral data to help B2B teams engineer repeatable pipelines and drive revenue. When he’s not helping startups go-to-market, you can find him hanging out in the lineup at Venice Breakwater.
Recommended for you


