As content writers, our right-sided brains hate math. Back in school, we dreaded when teachers asked us to show our work behind the answer to a problem. But while we still hate math, we now understand the reason behind always having to show our work: we needed to have the “why” backing how we got to a particular point.
The same goes for digital marketing. You want to know the true reasons why you’re implementing one marketing strategy over another! Our job today is to “show your work” for you, with 165 key digital marketing statistics in five different categories.
With this post in your back pocket, you’ll have the data points to back every marketing decision you make in 2025 and beyond with confidence.
Table of contents
- Why are digital marketing statistics important?
- General digital marketing statistics
- Online advertising statistics
- SEO statistics
- Social media marketing statistics
- Email marketing statistics
- Website statistics
- Even more digital marketing statistics
Why are digital marketing statistics important?
We know we need to prove the point of our work with digital marketing statistics, but here are a few other reasons why making data-backed decisions in marketing is so important:
- Statistics help you prioritize your efforts. If you’re implementing a multi-channel marketing strategy, you’ll want to know how certain platforms will perform compared to others. With statistics to back your choices, you’re able to know what channels might require more resources over others.
- Digital marketing statistics help you stay competitive. With these data points, you’re able to know what others are doing—which can help you jump ahead of your competitors.
- Stay on top of trends. Data reveals patterns and digital marketing trends that can help you to identify strategies and platforms where it might make sense to be an early adopter.
- Data can make room for other strategies. When you’re leveraging digital marketing statistics, you have full confidence in what’s going to work. That way, you can spend less time sweating your strategy and focus on other tasks, like auditing your website! After all, your digital marketing efforts will be fruitless without a strong website.
🌱 Use these digital marketing statistics to help grow your business with our free growth strategy template!
2025 digital marketing industry statistics
Get a birds’ eye view of the digital marketing industry with these FAQs and stats.
How big is the digital marketing industry?
- The global digital advertising and marketing market for 2024 is estimated at $667 billion and is projected to reach $786.2 billion by 2026.
- The U.S. digital advertising and marketing market is currently estimated at $460 billion.
What is the growth rate of digital marketing?
- The compound annual growth rate of digital marketing from 2020-2026 is projected at 9%.
- Digital display is projected to grow at a 15.5% CAGR, while search is projected to grow at 12.2%. Search accounts for 40.9% of the global digital advertising and marketing market.
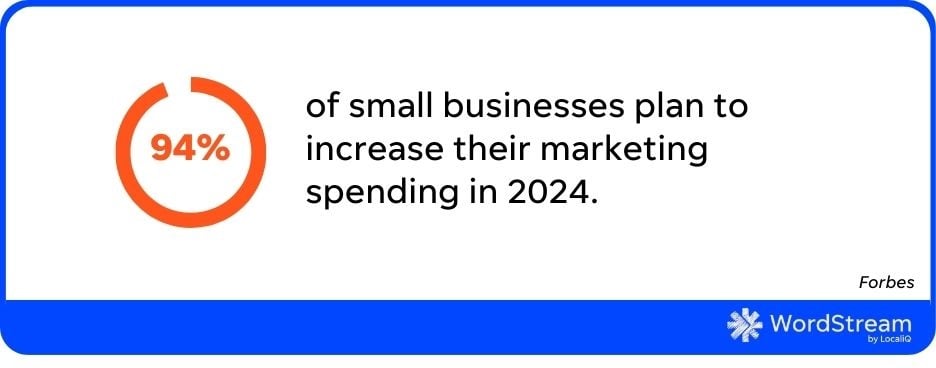
- 63% of businesses have already increased their digital marketing budgets in recent years. On top of this, 94% of small businesses plan to increase their marketing spending in 2024.
- Between 2023 and 2024, there was a 10% growth rate in digital marketing budget spending across businesses.
What is the success rate of digital marketing?
There is no one-size-fits-all answer to this question, but here are some stats to help point you in the right direction.
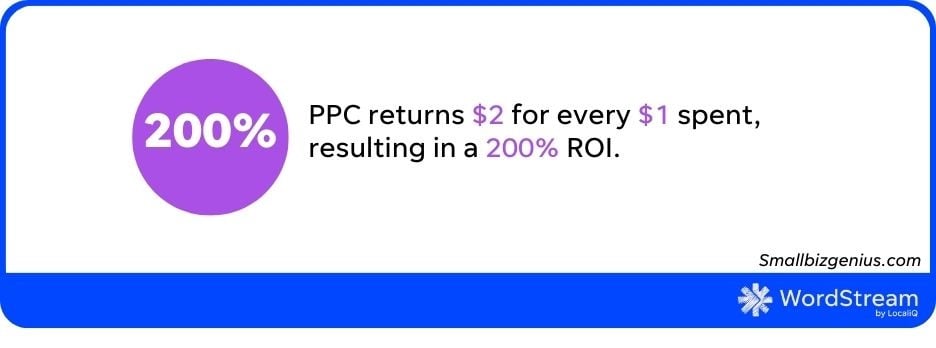
- PPC returns $2 for every $1 spent—resulting in a 200% ROI.
- Paid ad channels with the highest reported ROI rate are Facebook Ads and Google Ads.
- 49% of businesses say that organic search brings them the best marketing ROI.
- Email marketing returns $36 to $40 for every $1 spent.
- Small businesses claim that email marketing is the marketing channel that brings them the highest return on investment.
- Over 20% of businesses say that the number of leads generated is the primary factor they base the success of their marketing channels.
- Content marketing and SEO provides the best ROI according to marketers in this Databox report.
What percent of marketing is digital?
- 72% of overall marketing budgets get put towards digital marketing channels.
- It’s estimated that 60% of marketing was digital by the end of 2024 with offline media spending declining in recent years.
Is digital marketing in demand in 2025?
- According to the Bureau of Labor Statistics, marketing job demand is set to increase by 10% by 2026—above the average for all careers.
- Digital marketing is considered the fastest-growing in-demand job skill for 2025. In fact, digital marketing jobs are set to increase by 6% (higher than the average job growth rate) by 2032.
- Customer marketing managers and search marketing managers are both in CNBC’s list of the 10 fastest-growing jobs in the US.
More digital marketing statistics
-
- The average local business puts 5-10% of its revenue towards its digital marketing budget, but for larger businesses, that number can climb to about 14%.
- People spend 50% more with businesses that regularly respond to reviews.
- 93% of people read online reviews before making a purchase.
- Consumers can spend up to 5x longer on a site once they’ve interacted with bad reviews.
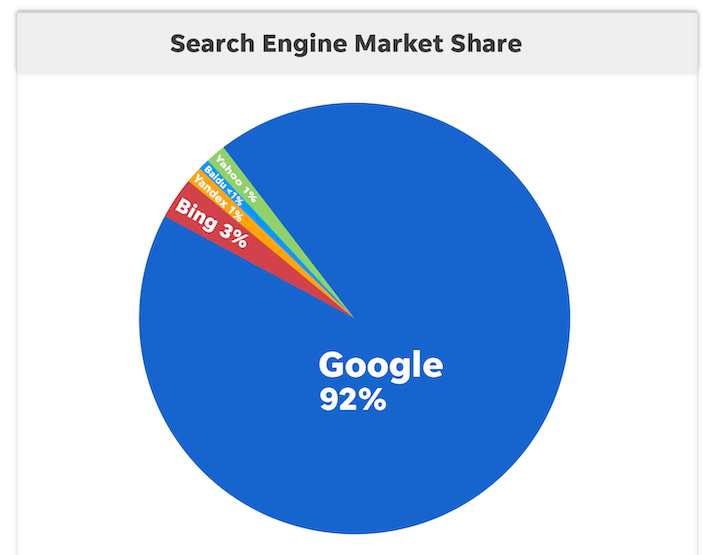
- Google holds 92% of the total worldwide search engine market share.
- 45% of shoppers buy online then pick up in-store.
- Three-quarters of businesses are reporting on how their marketing campaigns are directly influencing overall revenue.
- 52% of businesses are using marketing attribution reporting.
- 91% of businesses use CRM software for marketing and ppc reporting.
Online advertising statistics
Online advertising statistics help you understand what to spend where, so use these data points to frame up your marketing strategy.
How effective is online advertising?
- Digital ads can increase brand awareness by 80%.
- 90% of internet users will see a Google Ad during their online experience.
- Consumers are 155% more likely to look up your brand-specific terms after they’ve been exposed to display ads.
- Customers are 70% more likely to make a purchase from a retargeting ad.
- PPC returns $2 for every $1 spent—a 200% ROI.
- When someone conducts a search after initially seeing a related display ad, the likelihood of them converting is 59%.
- A user’s search activity rises 155% after being served a display ad.
- 27% of consumers conduct a search for a business after seeing their display ad.
- PPC generates double the number of website visitors that SEO brings in.
- Paid ad channels with the highest reported ROI rate are Facebook ads and Google Ads.
- PPC ads in search results account for 45% of page clicks.
- 75% of people say online ads make it easier to find what they’re looking for.
- Website visitors sourced from PPC ads have a 50% higher likelihood of converting than organic visitors.
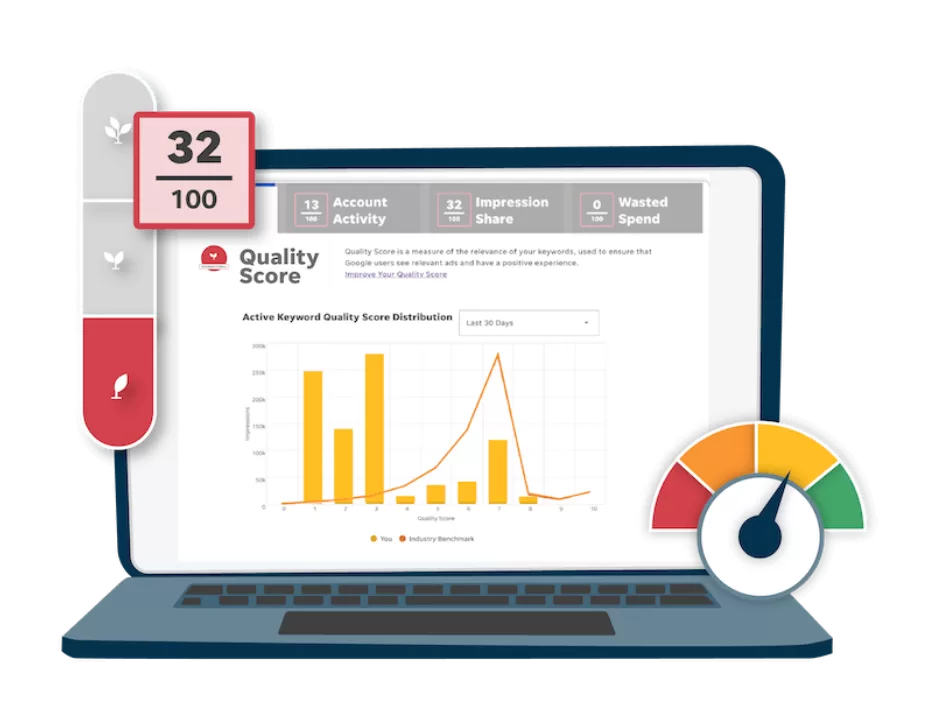
💡Are you getting the highest ROI with your PPC ads? Find out fast with the free Google Ads Performance Grader.
How big is the online advertising industry?
- Total search ad spend in 2024 amounted to $132 billion.
- Digital ad spend worldwide reached $485 billion in 2023 and grew to $526 billion by the end of 2024.
What percentage of advertising is online?
- 62% of advertising in the past year was online, and it’s projected to grow beyond 8.4% this year.
- The annual growth rate for digital media is higher than that of offline media.
What percentage of online advertising is on social media?
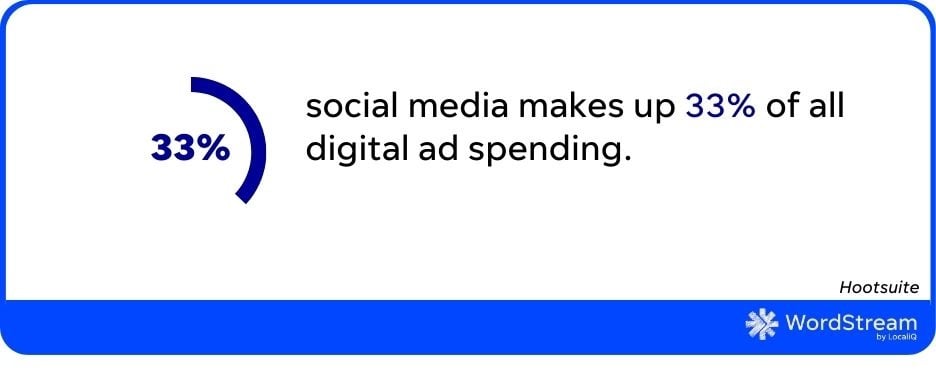
- Social media makes up 33% of all digital ad spending.
- Annual advertising spend on social media reached over $220 billion by the end of 2024.
- 15% of the average business’s website traffic comes from paid search, while paid social traffic only makes up 5% of overall website traffic.
How popular is digital advertising?
- 65% of small to mid-sized businesses have a PPC campaign.
- 45% of small businesses have a paid search strategy in place. On top of that, 55% use display ads.
- 96% of Google’s revenue comes from Google Ads.
More online advertising statistics
Before you spend a penny on online advertising, be sure to check out these PPC stats.
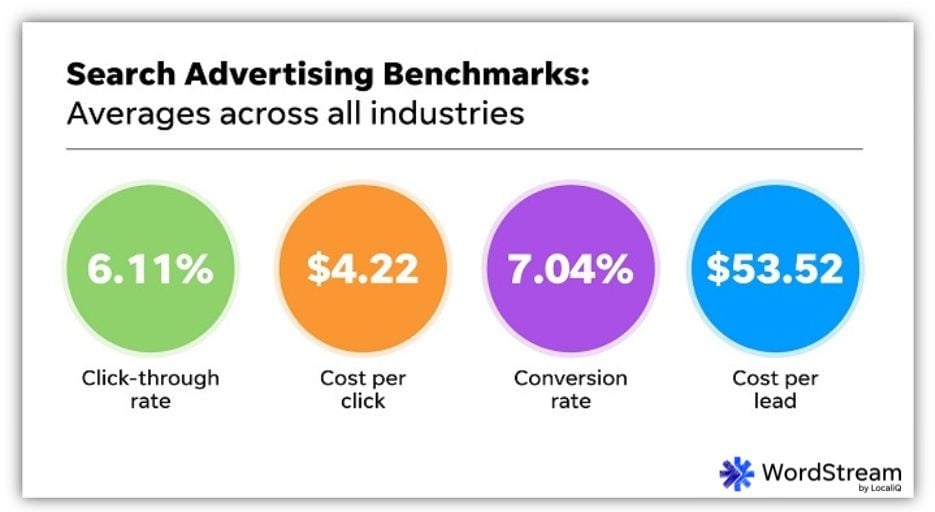
- For search ads, here are some industry benchmarks to keep in mind:
- The average click-through rate across all industries for Google Ads is 6.11%.
- The average cost per click across all industries is currently $4.22.
- The average cost per acquisition across all industries is $53.52.
- The average conversion rate across all industries is 7.04%.
- Digital ad fraud cost US advertisers $15.9 billion just this past year.
- Less than 20% of marketers use landing page A/B tests to improve conversion rates. Not sure what to test? Get some inspiration from these landing page examples.
- About 70% to 80% of people completely ignore paid digital ads. Be sure yours stand out with compelling ad copy that speaks to your target market.
2025 SEO statistics
These SEO trends and SEO statistics will paint the industry picture along with where your business fits into it.
How much is the SEO industry worth?
- The SEO industry in 2024 is worth nearly $90 billion, up from $75 billion in 2023.
How much traffic does SEO generate?
- 53% of all website traffic comes from organic searches.
- Businesses that blog get 55% more traffic to their websites.
Is SEO still relevant in 2025?
- 61% of marketers say that generating traffic and leads is their number one challenge…so yes.
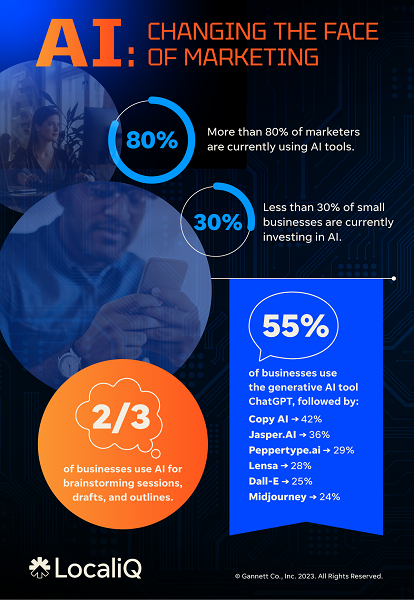
- As the use of generative AI increases, SEO workflows are changing. For example, while two-thirds of businesses are using AI for content brainstorming sessions, drafts, and outlines, 25% of businesses are worried about the impact of AI on website traffic.
How does SEO increase ROI?
- SEO leads have nearly a 15% close rate.
- 49% of businesses say that organic search brings them the best marketing ROI.
How much do big companies spend on SEO?
- Big companies can spend anywhere from $10,000-$20,000 on SEO per month, depending on where they are in their strategy.
- Small to medium-sized companies can spend anywhere from $5,000-$10,000 per month on SEO.
- Small and local businesses spend $1,000-$5,000 per month on SEO.
What percentage of people go to page 2 on Google?
- Only 25% of people go to page two on Google. In other words, 75% of people never scroll past the first page of the SERP.
What is a good organic search percentage?
- The top-ranking site in Google organic search results has an average CTR of 31%.
- A good average organic CTR is between 3-5%.
More SEO statistics
Here are some more SEO trends and stats to pay attention to this year.
- The average voice search result is only 29 words in length. Stay voice search competitive by keeping your brand’s organic results concise with power words that help get your point across quickly.
- 46% of all Google searches are for a local product or service.
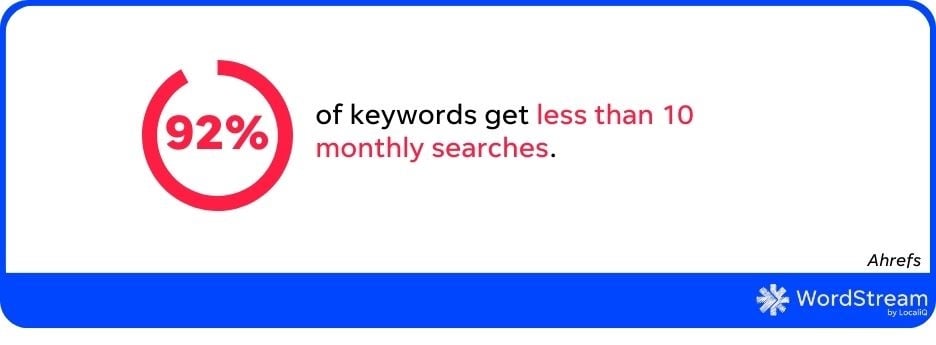
- About 92% of keywords get ten monthly searches or fewer.
🔎 Identify high-volume keywords using our Free Keyword Research Tool.
- If local SEO is a focus for your brand, you’re in luck as 28% of local searches result in a purchase within 24 hours.
- There are over 200 factors Google’s algorithm looks at when ranking a website.
- A quarter of small business websites don’t even have an H1 tag.
- It’s no secret that content marketing is key for growing businesses—especially since brands that blog have 434% more indexed pages than those that don’t.
- Half of all browser-based searches on Google end with no clicks. To combat this, try marketing with emotion in your content to turn uninterested searchers into click-happy visitors.
- Google Analytics is the most heavily used SEO tool right now.
2025 social media marketing statistics
Social media marketing statistics prove just how fast the space is growing, and these are data points you won’t want to miss out on this year.
How big is the social media market?
- The social media market size is estimated to be worth almost $256 billion by 2028.
- 93% of internet users are on social media.
What percentage of marketing is done on social media?
- On average, businesses allocate 14.9% of their marketing budget towards social media.
How many businesses use social media for marketing?
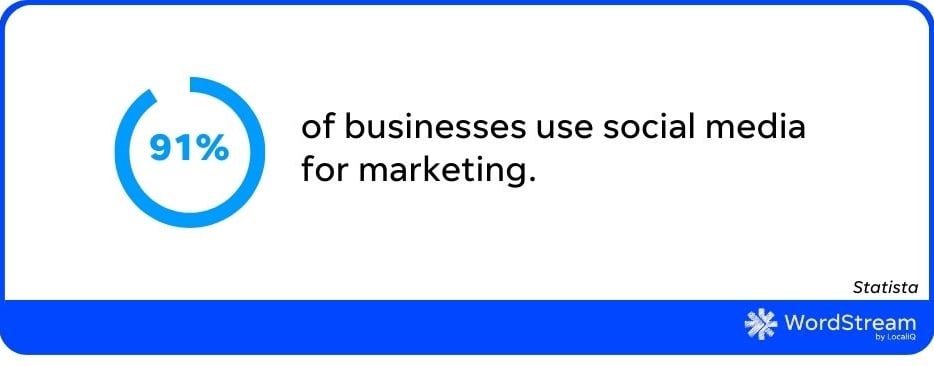
- Over 91% of businesses use social media for marketing.
How competitive is the social media industry?
- 93% of businesses are active on Facebook, and 86% also take advantage of Facebook advertising.
- Currently, there were 67 million companies on LinkedIn in 2024—which increased from 55 million in 2023.
- There are more than 200 million business accounts on Instagram.
- More than 35 million businesses are viewable on Snapchat—a 5 million increase from last year.
What is the fastest-growing social media platform in 2025?
- TikTok is the fastest-growing social media platform, with 40% of businesses planning to incorporate TikTok into their 2024 social media strategy.
- TikTok reached 1 billion active users in just five years (it took Facebook eight!), with 100 million of those users being US-based.
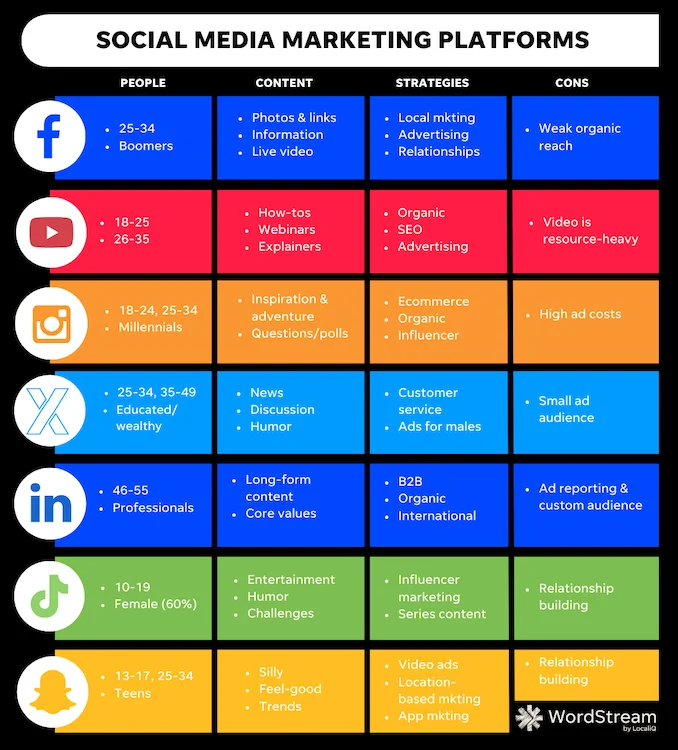
What’s the most popular social media channel in 2025?
The most popular social media platform in 2024 was Facebook and should be in 2025, too, however this can vary based on what types of demographics your business is specifically looking for. Check out our handy image below to see what platform is most popular for your audience and industry:
How much did social media advertising cost in 2024?
Here are some Facebook advertising industry benchmarks from 2024 to keep in mind:
For Facebook ads traffic campaigns:
- The average click-through rate across industries is 1.51%.
- The average cost per click across industries is $0.83.
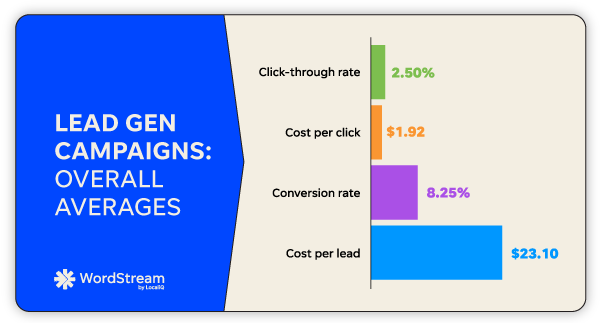
For Facebook ads lead gen campaigns:
- The average click-through rate across industries is 2.50%.
- The average cost per click across industries is $1.92.
- The average conversion rate across industries is 8.25%.
- The average cost per lead across industries is $23.10.
More social media marketing statistics
- The average US adult spends over 2 hours on social media every day.
- 91% of consumers access social media sites from a mobile device. This means you’ll want to be sure your mobile marketing strategy includes social media.
- Nearly half of social media users rely on brand recommendations from influencers. Check out our influencer marketing breakdown to see how you can take advantage of this trend.
- Less than 5% of businesses use Facebook video ads, so this is a major opportunity for brands looking to stand out.
- 90% of Instagram users follow at least one business on the platform.
- Over 80% of B2B businesses use X for organic social media marketing and X (Twitter) ads.
- There are 397 million daily active Snapchat users, and they’re opening the app more than 30 times per day.
- Snapchat users are more likely to buy products or services from their mobile device. They’re also 60% more likely to make impulse purchases.
- The average swipe-up rate for Snapchat ads is 50% and the average cost per swipe is just $.30-$1.00.
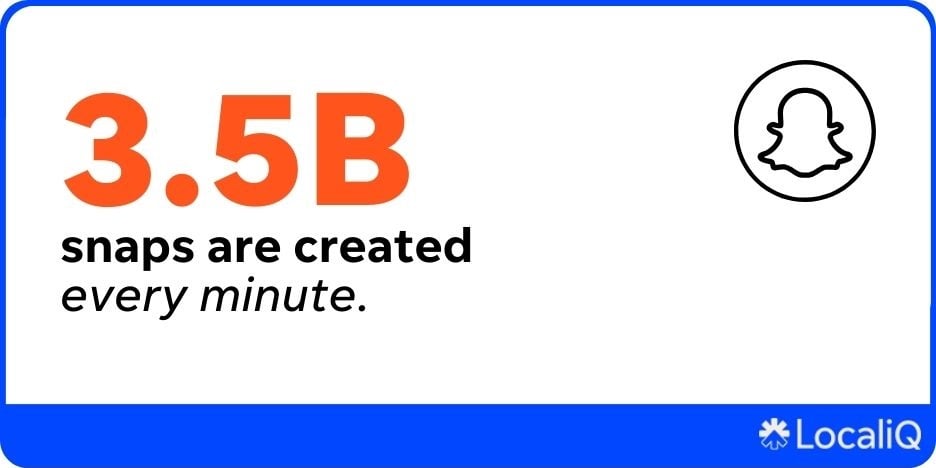
- 5 billion Snaps are created daily worldwide.
- The social media platform that is most trusted by US consumers is LinkedIn.
- 80% of B2B businesses use LinkedIn Advertising, and 96% of B2B content marketers use LinkedIn for organic social media marketing.
- 30% of the average business’s engagement on LinkedIn comes from its employees.
- LinkedIn Ads is a leading platform for audience targeting with over 200 targeting characteristics marketers can choose from.
- TikTok wins as the social media platform with the highest engagement rate per post.
- 72% of TikTok users find TikTok ads “inspiring,” and 70% of users said that TikTok ads were even enjoyable.
- 25% of people on TikTok have researched or purchased a product after seeing a TikTok about it.
- 95% of Pinterest users have the app to help them plan or make a purchase. In fact, 52% of Pinterest users have seen something on the app and made the purchase online later.
- 64% of consumers watching branded videos on social media made a purchase after.
2025 email marketing statistics
Check out these statistics that show just how effective email marketing can be.
How much is the email marketing industry worth?
- The email marketing industry is set to grow to $17.9 billion by 2027.
How big is the email marketing industry?
- The number of global email users is grew to 48 billion users by the end of 2024.
What is the success rate of email marketing?
- The average open rate across all industries is 80% and the average click-through rate is 2.78%.
- Small businesses claim that email marketing is the marketing channel that brings them the highest return on investment.
What is the average ROI for email marketing?
- The average ROI for email marketing is $36 to $40 for every $1.
What percentage of emails are marketing?
- While available data does not provide a clear percentage, it’s known that marketing emails are prevalent in inboxes. In fact, there are 2 billion emails being sent per day, with people receiving about 120 marketing emails per day.
Does email marketing still work in 2025?
- 87% of businesses use email marketing to distribute their content. This makes it the second most popular marketing channel, behind social media at 89%.
Is email marketing growing?
- The number of emails sent per day is set to grow by 2 billion in the coming years. This means email will become more popular among users, and inherently marketers too.
- 78% of marketers said email is important to overall company success.
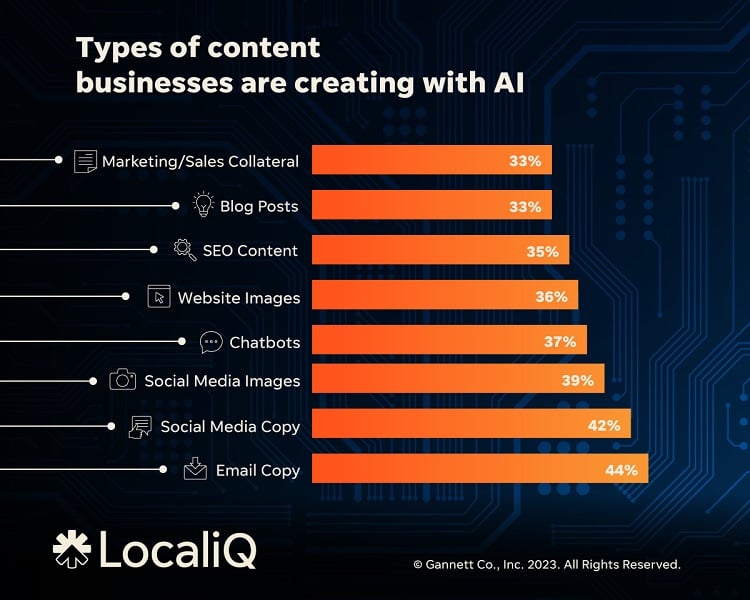
- Email marketing copy is one of the top use cases for generative AI, as 41% of businesses are using AI to create email content.
More email marketing statistics
- 64% of small businesses say they use email marketing to reach their ideal customers.
- About 1 in every 5 email campaigns is not mobile device friendly.
- 80% of marketers say they’d rather give up social media than email marketing.
- 64% of small businesses already leveraging email marketing, so you won’t want to miss out on taking advantage of this low-cost way to promote your business.
- 33% of people will open an email simply because they think the subject line is catchy.
- 47% of email recipients decide to open an email based on the subject line alone.
2025 website statistics
Use these wild website statistics to help increase your website visibility and performance.
Why is website optimization important?
- It takes about half a second for visitors to form an opinion about your website.
- 38% of people will stop engaging with a website if the content or layout is unattractive.
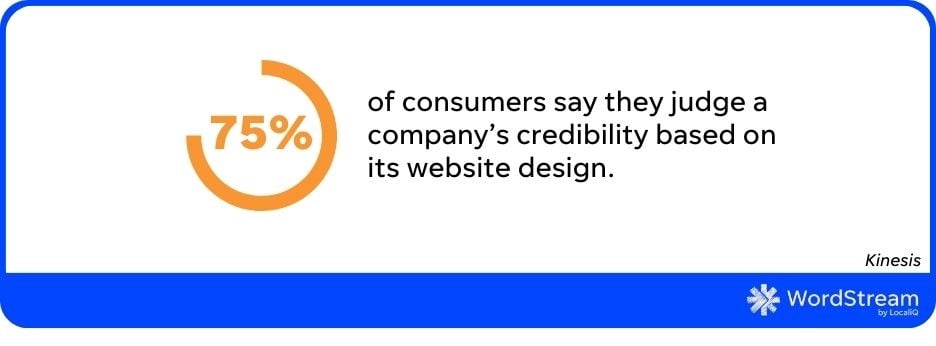
- Three-quarters of consumers say they judge a company’s credibility based on its website design.
- Websites that have a superior user experience generate a 400% higher conversion rate.
What is a good website page load speed?
- Nearly half of all consumers expect a maximum loading time of 2 seconds for the average website.
What percent of businesses have a website?
- 72% of small businesses have a website.
More website statistics
- Nearly 60% of people said they wouldn’t recommend a business if it had a poorly designed mobile website.
- About 40% of people will stop interacting with a website if images take too long to load.
- 70% of small business websites are missing a call to action on their homepage.
- Nearly 90% of consumers will shop with a competitor after a poor website experience.
- Investing in your site’s user experience leads to a $100 return for every $1 you spend.
- 73% of businesses invest in web design to help their brand stand out from competitors.
- 44% of consumers tell others about negative website experiences.
- On average, users read 28% of the text on a website’s page.
- 90% of website pages don’t generate organic traffic. Find what optimizations you can apply to your website with our complete, visual guide to on-page SEO.
- Over half of all worldwide website traffic comes from mobile phones.
- Load times longer than 2 seconds will increase bounce rates by 50%.
- About half of the websites that rank high on the SERP are HTTPS. 85% of people will abandon a page if they realize it’s an unsecured website—even if they already have a purchase in process.
- 43% of small businesses that do have a website plan on improving their website performance this year.
🖱Want to improve your website performance? Try our free, instant Website Grader!
Even more digital marketing statistics for 2025
Hungry for more digital marketing statistics? I’ve got your back with these additional digital marketing trends:
- US ecommerce revenue increased by 7% between 2021 and 2022. Total ecommerce sales in the US was projected to reach $1,001.5 billion by 2023.
- 60% of marketers either don’t know or don’t understand their Core Web Vitals.
- Video marketing is the most popular media tactic for content marketers.
- 49% of businesses report that they grow revenue faster when they’re using video content.
- 86% of consumers say they’d like to see more video content from brands they love.
- 73% of customers are willing to spend more with a brand that has complete transparency online.
- 76% of brands report having used marketing automation just this past year.
- In 2024, 42% of businesses increased their investment in AR and VR strategies.
- Consumers are 35x more likely to open mobile messages than emails.
- Mobile advertising accounted for 77% of all digital ad spend in 2024.
- Video marketing is on the rise, with 92% of businesses already considering it one of the most important parts of their digital marketing strategies.
- U.S. online retail sales are amounted to over $1,000 billion at the end of 2024.
Use these digital marketing statistics to guide your 2025 strategy
Next time you need to show the “why” behind your marketing strategies, whip out these handy digital marketing statistics. When you feel like there may be no rhyme or reason to your tactics (I’ve been there) the numbers are there to help. If any of these statistics surprise you and make you feel inclined to readjust your business’s digital marketing strategy, see how our solutions can get help you get ahead of the top 2025 marketing trends!

Meet The Author
Susie Marino
Susie is the Senior Content Marketing Specialist for WordStream and LocaliQ, where she uses her experience as a PPC consultant to share tips, tactics, and best practices in the ever-evolving marketing and advertising space. Susie’s work has been featured in publications such as Search Engine Land, MediaPost, Social Media Today, and others. Outside of work, Susie loves to get outside for some snowboarding or (once the cold weather melts away) hiking!
Recommended for you

![Search Advertising Benchmarks for Your Industry [Report]](https://www.wordstream.com/wp-content/uploads/2024/04/RecRead-Guide-Google-Benchmarks.webp)