With over 2 billion daily active users, Facebook still reigns supreme as the most popular social media platform. And that’s part of the reason that Facebook ads continue to be an extremely popular solution for businesses looking to raise brand awareness, connect with prospects, and get new customers.
So how do you know if your Facebook ads are really working? We’ve got the data to answer your questions!
Just in time to inform your marketing planning and help you better understand how your Facebook advertising campaigns are performing now, we’re sharing Facebook ads benchmarks across 20 industries, including benchmarks for click-through rate, cost per click, conversion rate, and more for two popular Facebook ads campaign objectives.
Check out our latest, updated version of this Facebook ads benchmarks report here!
Table of contents
- Key trends: The big picture
- Facebook ads benchmarks: Traffic campaigns
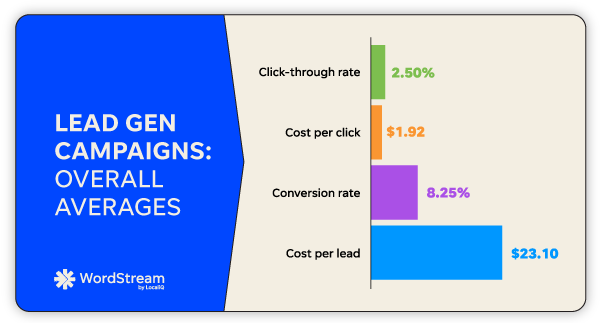
- Facebook ads benchmarks: Lead gen campaigns
- How to improve your Facebook ads results
Key trends: The big picture
Over the last year, most businesses have seen their Facebook ads results improve, meaning their engagement metrics are going up and their advertising costs are going down. Here’s a deeper look:
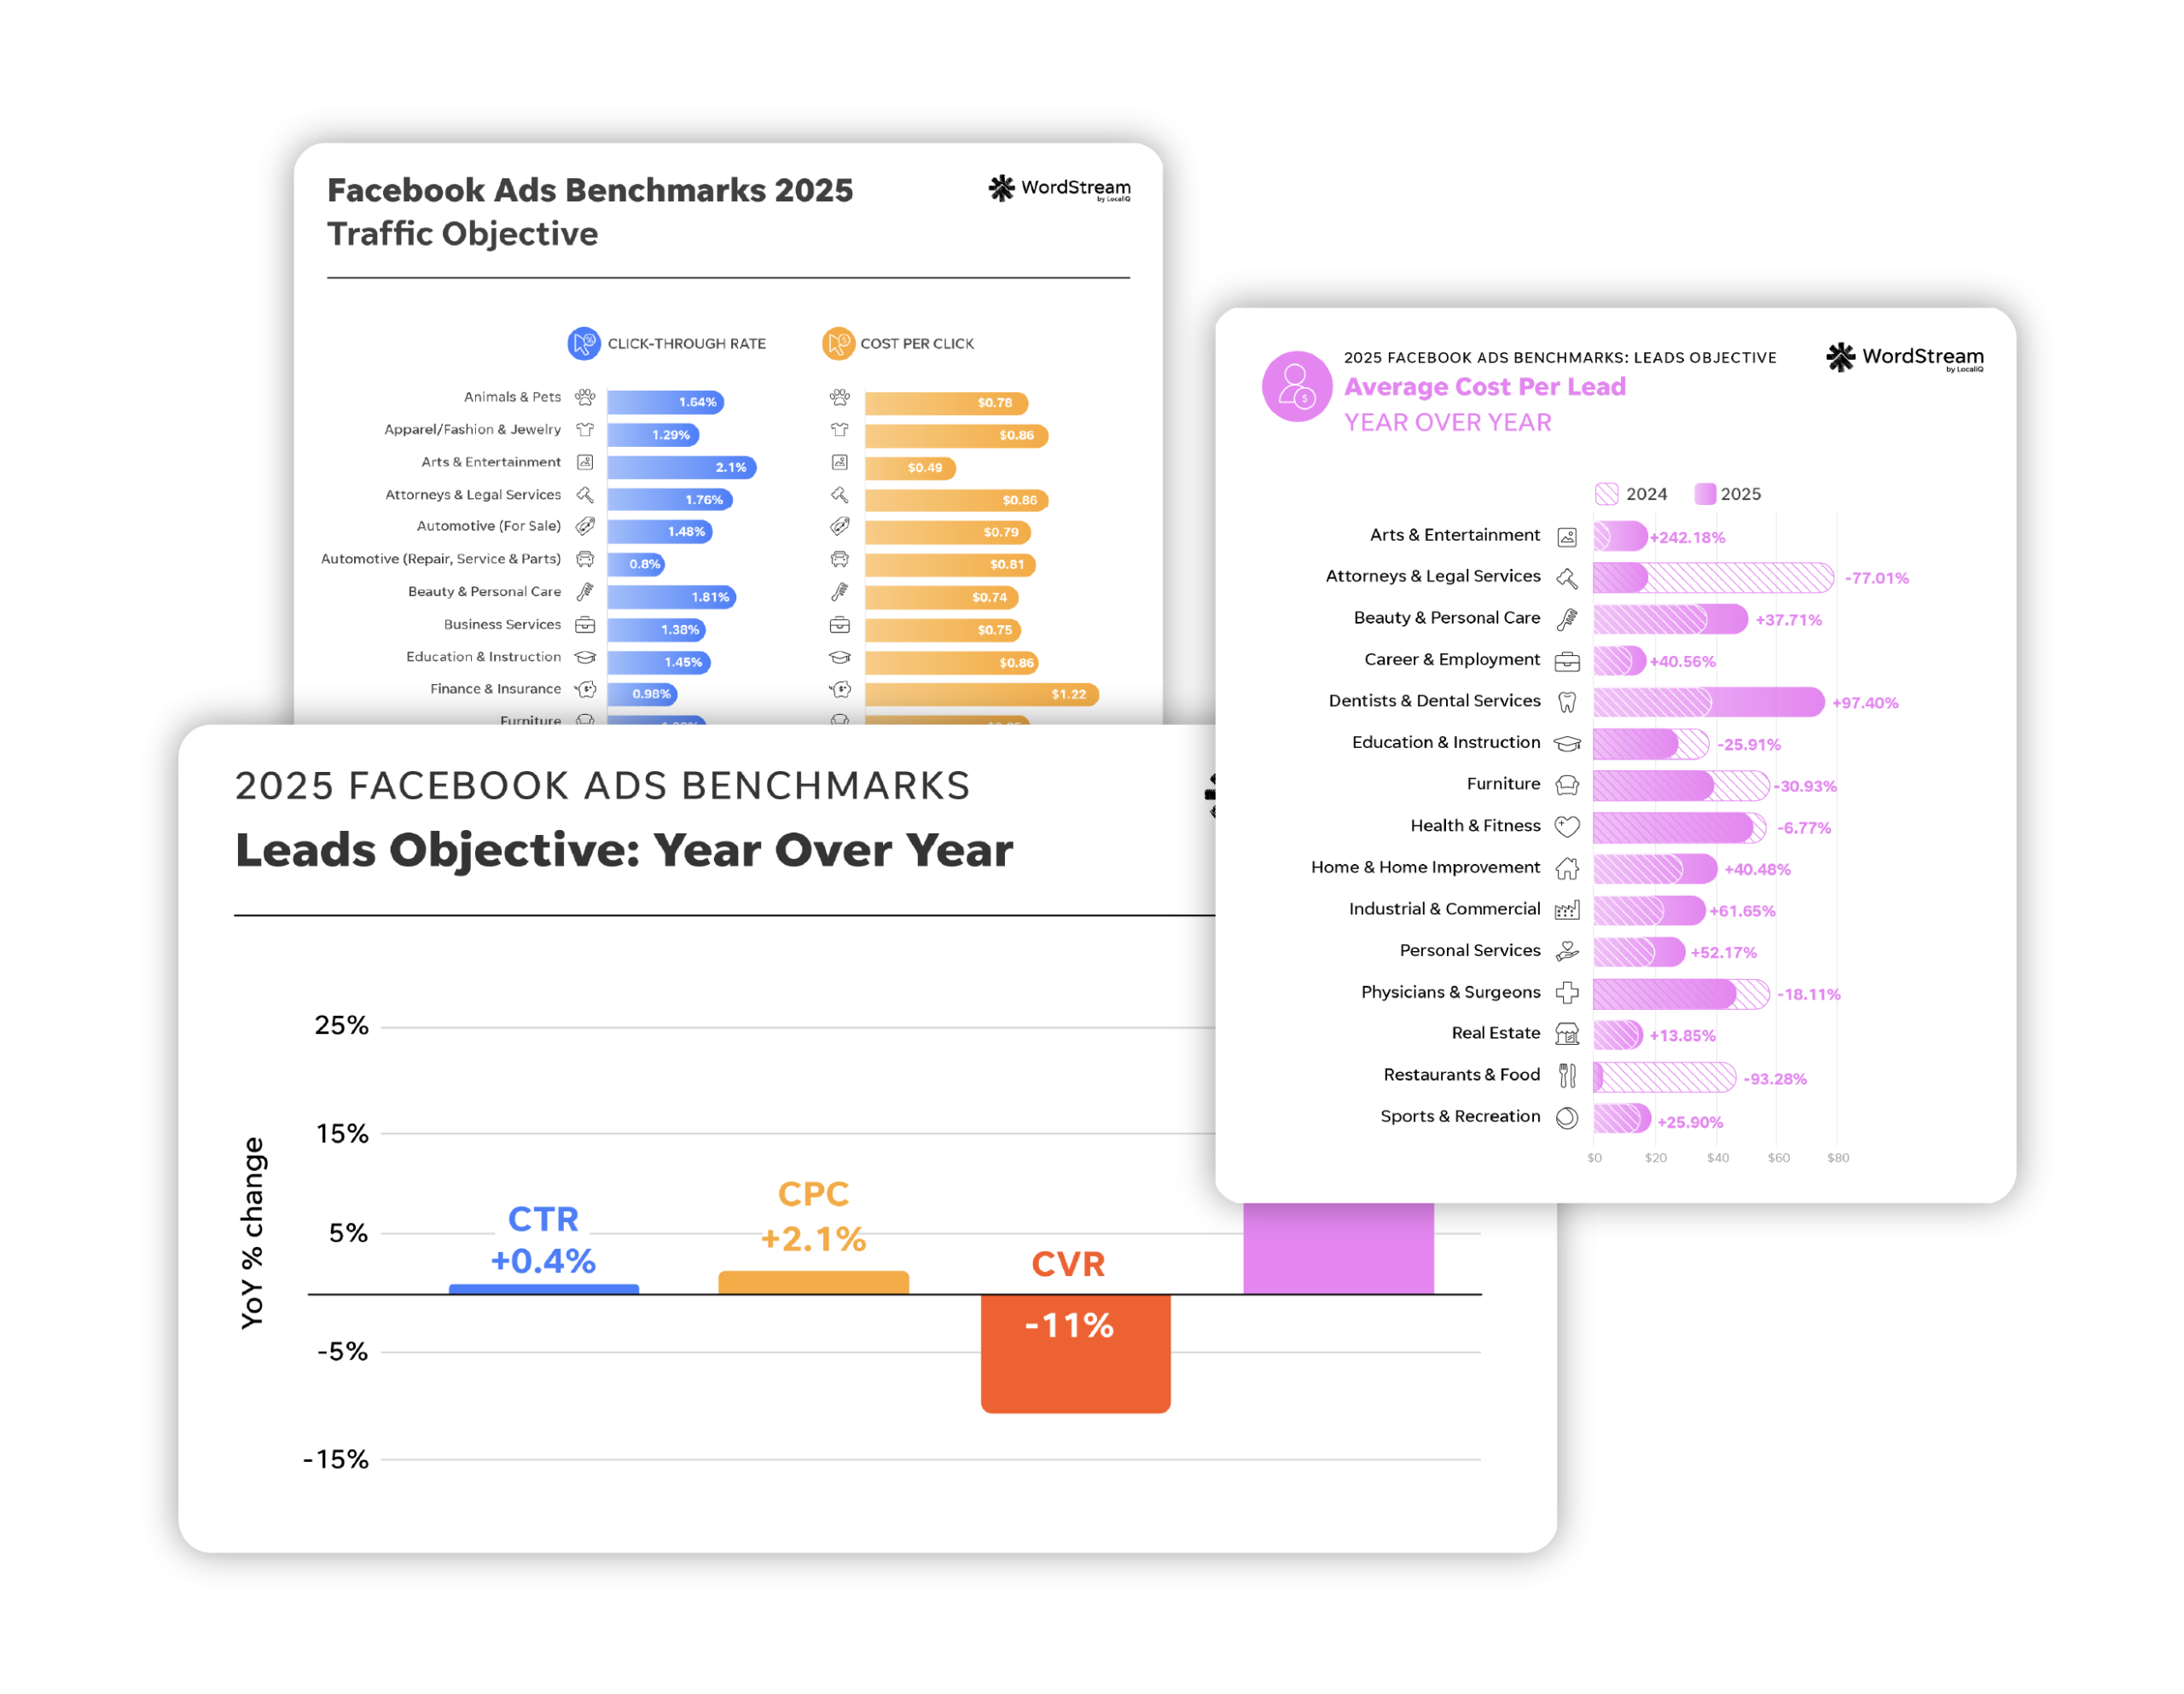
- Click-through rate (CTR) increased year over year for 9 out of 19 industries using Facebook Lead Ads. Some of those increases were fairly significant, especially for Arts & Entertainment and Education & Instruction. CTR decreased YOY for 15 out of 23 industries in the traffic objective, but average CTR still remains higher than other available data shows (1.51% vs. 0.9%).
- Cost per click (CPC) largely decreased year over year. 9 industries saw a decrease in CPC YOY for the leads objective, while 14 saw a decrease YOY for the traffic objective. And for each objective, the increases weren’t drastic. This is interesting given the drastic increase in CPC across most (91%) industries for search advertising.
- For the leads objective, 13 out of 19 industries saw conversion rate (CVR) increase year over year. The economy could play a role in the industries that saw decreases YOY. For example, with a volatile housing market, fewer people may have been looking to buy or sell, leading to a decrease in CVR for real estate businesses.
- For the leads objective, cost per lead (CPL) stayed the same or decreased for 12 out of 19 industries. Again, it’s interesting to see this trend given the drastic increase in CPL on the search ads side, where 91% of industries saw increases in CPL in 2023.
The overall key takeaway? Facebook advertising continues to offer complementary advantages to search ads because of lower and more stable costs.
“One of the biggest things I’m always impressed with on Facebook is that, although advertising CPCs generally fluctuate across the board, Facebook ads CPCs differ so much less than what you might see on Google Ads or other search networks,” said Mark Irvine, Director of Paid Media at Search Labs.
⬇️ Download the latest Facebook Ads Benchmarks here!
Facebook ads benchmarks for traffic campaigns by industry
Facebook advertising allows you to choose specific ad objectives for each campaign. It then optimizes your campaigns against that objective, which helps you reach specific goals with your Facebook ads.
The traffic objective in Facebook ads optimizes your campaign to drive clicks from your ads to your landing page, app, or event. Traffic campaigns are popular among many small business advertisers because they help to drive more visitors (and potential customers!) to your website.
| Business category | Avg. click-through rate | Avg. cost per click |
| Animals & Pets | 1.63% | $0.76 |
| Apparel / Fashion & Jewelry | 1.13% | $1.11 |
| Arts & Entertainment | 2.55% | $0.44 |
| Attorneys & Legal Services | 0.99% | $1.15 |
| Automotive — For Sale | 1.18% | $0.70 |
| Automotive — Repair, Service & Parts | 0.99% | $0.99 |
| Beauty & Personal Care | 1.34% | $0.88 |
| Business Services | 1.37% | $0.84 |
| Career & Employment | 1.31% | $0.70 |
| Dentists & Dental Services | 0.81% | $1.27 |
| Education & Instruction | 1.20% | $0.79 |
| Finance & Insurance | 0.88% | $1.11 |
| Furniture | 1.15% | $1.19 |
| Health & Fitness | 1.68% | $0.90 |
| Home & Home Improvement | 1.23% | $0.95 |
| Industrial & Commercial | 1.03% | $0.80 |
| Personal Services | 1.28% | $0.87 |
| Physicians & Surgeons | 1.02% | $1.08 |
| Real Estate | 2.45% | $0.65 |
| Restaurants & Food | 2.29% | $0.52 |
| Shopping, Collectibles & Gifts | 1.82% | $0.65 |
| Sports & Recreation | 1.30% | $0.77 |
| Travel | 2.06% | $0.43 |
Note: Since this campaign objective is specifically designed to drive traffic, cost per lead and conversion rate metrics tend to be on the higher side. It’s important to focus on the metrics that matter most for your ad objective, so we’ve omitted those metrics here.
Average click-through rate in Facebook ads for traffic campaigns
CTR or click-through rate is a measure of how frequently viewers click on your ad. Essentially, your campaign’s CTR indicates how compelling and click-worthy viewers deem your Facebook ads. For this reason, higher CTRs are a sign of strong Facebook ad copy and creative.
The average click-through rate in Facebook ads for traffic campaigns across all industries is 1.51%.
|
Business category |
Avg. click-through rate |
| Animals & Pets | 1.63% |
| Apparel / Fashion & Jewelry | 1.13% |
| Arts & Entertainment | 2.55% |
| Attorneys & Legal Services | 0.99% |
| Automotive — For Sale | 1.18% |
| Automotive — Repair, Service & Parts | 0.99% |
| Beauty & Personal Care | 1.34% |
| Business Services | 1.37% |
| Career & Employment | 1.31% |
| Dentists & Dental Services | 0.81% |
| Education & Instruction | 1.20% |
| Finance & Insurance | 0.88% |
| Furniture | 1.15% |
| Health & Fitness | 1.68% |
| Home & Home Improvement | 1.23% |
| Industrial & Commercial | 1.03% |
| Personal Services | 1.28% |
| Physicians & Surgeons | 1.02% |
| Real Estate | 2.45% |
| Restaurants & Food | 2.29% |
| Shopping, Collectibles & Gifts | 1.82% |
| Sports & Recreation | 1.30% |
| Travel | 2.06% |
The industries with the highest CTR were Arts & Entertainment at 2.55%, Real Estate at 2.45%, and Restaurants & Food at 2.29%.
The industries with lower average CTR were Dentists & Dental Services at 0.81%, Finance & Insurance at 0.88%, and Attorneys & Legal Services at 0.99%.
“CTRs differ strongly between different business types across Facebook, even more so than on Google Ads. Successful Facebook Ads require impressive, visual proof to attract attention from the scrolling audience—and that's why you see some of the best Facebook ads CTRs from those industries that can wow us with the promise of a good time, like Travel, Arts & Entertainment, and Sports,” said Irvine.
“These industries both fit in with the content we’re used to seeing on our feeds from our friends,” he added. “A night out or tropical getaway can be far more attractive than a visual portrayal of an automotive repair or a visit to the dentist. We see those strong divides in the Facebook ads CTR performance in these types of industries.”
Average cost per click in Facebook ads for traffic campaigns
Cost per click or CPC is a calculation of your total spend divided by your total number of clicks. Maintaining a lower average CPC on your traffic campaign means you can catch and convert website visitors at an overall cheaper cost.
For the traffic objective, a click would be a click from your ad to your website or whatever destination you set for your ad.
The average cost per click in Facebook ads for traffic campaigns across all industries is $0.83. This is much lower than the average cost per click in Google Ads of $4.22.
| Business category | Avg. cost per click |
| Animals & Pets | $0.76 |
| Apparel / Fashion & Jewelry | $1.11 |
| Arts & Entertainment | $0.44 |
| Attorneys & Legal Services | $1.15 |
| Automotive — For Sale | $0.70 |
| Automotive — Repair, Service & Parts | $0.99 |
| Beauty & Personal Care | $0.88 |
| Business Services | $0.84 |
| Career & Employment | $0.70 |
| Dentists & Dental Services | $1.27 |
| Education & Instruction | $0.79 |
| Finance & Insurance | $1.11 |
| Furniture | $1.19 |
| Health & Fitness | $0.90 |
| Home & Home Improvement | $0.95 |
| Industrial & Commercial | $0.80 |
| Personal Services | $0.87 |
| Physicians & Surgeons | $1.08 |
| Real Estate | $0.65 |
| Restaurants & Food | $0.52 |
| Shopping, Collectibles & Gifts | $0.65 |
| Sports & Recreation | $0.77 |
| Travel | $0.43 |
The industries that saw the lowest cost per click were Travel at $0.43, Arts & Entertainment at $0.44, and Restaurants & Food at $0.52.
The industries that saw higher-than-average costs per click were Dentists & Dental Services at $1.27, Furniture at $1.19, and Attorneys & Legal Services at $1.15. Again, these CPCs are still lower than the average CPC for Google Ads at over $4. Plus, these industries have fairly high lifetime average customer costs, so it makes sense that their advertising costs would be higher than a restaurant or entertainment venue.
“The biggest trend I am seeing with this Facebook ads CPC data is that consumer demand remains strong despite the uncertain economy. Cost per click is well within range of what we’ve been quoting advertisers for years now, while click-through rate also remains strong,” said Tyler Mask, Senior Manager of Custom Solutions at LocaliQ.
💡 Want to know how your Facebook ads compare to the competition? Find out with our free Facebook Ads Grader.
Facebook ads benchmarks for lead generation campaigns by industry
Facebook ads running with the leads objective are meant to drive leads through form fills, messages, calls, and conversions.
In a leads objective campaign, you’ll be running Facebook Lead Ads, which include prompts directly within the ad to help you collect lead information.
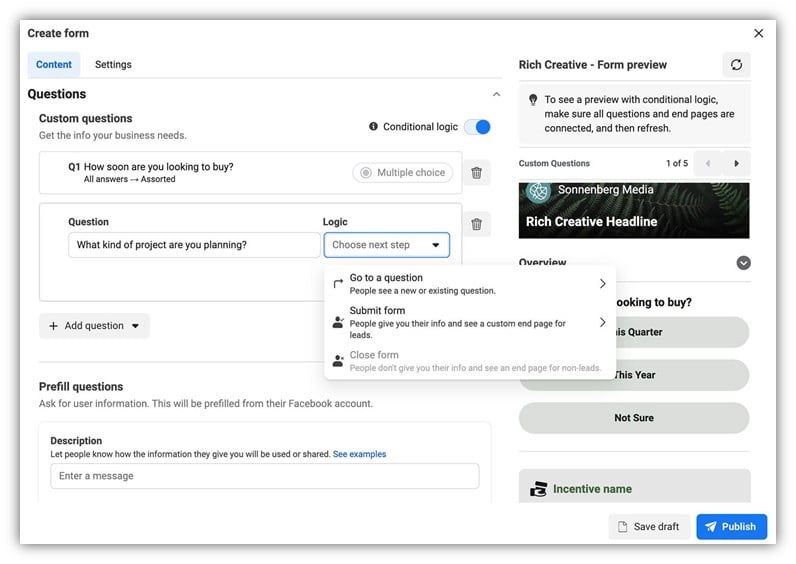
An example of the Facebook Lead Ad form creation process.
We’ve included conversion rate and cost per lead as part of these benchmarks since this objective is optimized to drive leads and conversions.
| Business category | Avg. click-through rate | Avg. cost per click | Avg. conversion rate | Avg. cost per lead |
| Arts & Entertainment | 3.70% | $0.87 | 9.77% | $13.46 |
| Attorneys & Legal Services | 1.79% | $5.42 | 5.92% | $78.26 |
| Automotive -- Repair, Service & Parts | 1.38% | $2.86 | 5.35% | $58.56 |
| Beauty & Personal Care | 2.46% | $2.16 | 4.61% | $52.46 |
| Business Services | 2.70% | $1.73 | 7.57% | $22.65 |
| Career & Employment | 2.37% | $1.34 | 7.02% | $18.17 |
| Dentists & Dental Services | 1.80% | $3.82 | 11.34% | $29.08 |
| Education & Instruction | 2.44% | $1.80 | 8.05% | $27.94 |
| Finance & Insurance | 1.98% | $2.94 | 5.62% | $30.88 |
| Furniture | 2.55% | $1.58 | 7.29% | $29.08 |
| Health & Fitness | 1.66% | $3.60 | 5.76% | $60.95 |
| Home & Home Improvement | 1.80% | $2.08 | 8.90% | $20.49 |
| Industrial & Commercial | 1.50% | $2.69 | 10.13% | $37.71 |
| Personal Services (Weddings, Cleaners, etc.) | 2.72% | $1.88 | 8.76% | $19.49 |
| Physicians & Surgeons | 3.17% | $3.63 | 4.99% | $60.95 |
| Real Estate | 3.69% | $1.22 | 9.58% | $12.43 |
| Restaurants & Food | 1.85% | $2.61 | 5.63% | $45.15 |
| Sports & Recreation | 3.29% | $1.11 | 8.24% | $15.33 |
| Travel | 6.62% | $0.96 | 3.95% | $26.05 |
Average click-through rate in Facebook ads for lead gen campaigns
Although Facebook lead ads don’t necessarily require users to click to your website, they’ll have to click on the ad to become a lead. Plus, the option to click to your website still exists on the ad. You should prioritize a high click-through rate for your Facebook leads objective campaigns because it signals that your ad is attracting users to take action.
The average click-through rate in Facebook ads for lead gen campaigns across all industries is 2.50%.
| Business category | Avg. click-through rate |
| Arts & Entertainment | 3.70% |
| Attorneys & Legal Services | 1.79% |
| Automotive -- Repair, Service & Parts | 1.38% |
| Beauty & Personal Care | 2.46% |
| Business Services | 2.70% |
| Career & Employment | 2.37% |
| Dentists & Dental Services | 1.80% |
| Education & Instruction | 2.44% |
| Finance & Insurance | 1.98% |
| Furniture | 2.55% |
| Health & Fitness | 1.66% |
| Home & Home Improvement | 1.80% |
| Industrial & Commercial | 1.50% |
| Personal Services (Weddings, Cleaners, etc.) | 2.72% |
| Physicians & Surgeons | 3.17% |
| Real Estate | 3.69% |
| Restaurants & Food | 1.85% |
| Sports & Recreation | 3.29% |
| Travel | 6.62% |
The industries that saw the best CTRs on their Facebook ads running with the leads objective were Travel at 6.62%, Arts & Entertainment at 3.70%, and Real Estate at 3.69%.
The industries with the lowest CTRs were Automotive – Repair, Service & Parts at 1.38%, Industrial & Commercial at 1.50%, and Health & Fitness at 1.66%.
Average cost per click in Facebook ads for lead gen campaigns
Every time a user clicks on your Facebook lead ads, you get charged—so trying to keep your average CPC as low as possible is a no-brainer. That said, you’ll also want to take your lead quality into consideration when evaluating your CPC. If your priority is to get the highest quality leads possible, then they may be worth the slightly higher CPC.
The average cost per click in Facebook ads for the leads gen campaign across all industries is $1.92.
| Business category | Avg. cost per click |
| Arts & Entertainment | $0.87 |
| Attorneys & Legal Services | $5.42 |
| Automotive -- Repair, Service & Parts | $2.86 |
| Beauty & Personal Care | $2.16 |
| Business Services | $1.73 |
| Career & Employment | $1.34 |
| Dentists & Dental Services | $3.82 |
| Education & Instruction | $1.80 |
| Finance & Insurance | $2.94 |
| Furniture | $1.58 |
| Health & Fitness | $3.60 |
| Home & Home Improvement | $2.08 |
| Industrial & Commercial | $2.69 |
| Personal Services (Weddings, Cleaners, etc.) | $1.88 |
| Physicians & Surgeons | $3.63 |
| Real Estate | $1.22 |
| Restaurants & Food | $2.61 |
| Sports & Recreation | $1.11 |
| Travel | $0.96 |
The industries with the lowest CPCs were Arts & Entertainment at $0.87, Travel at $0.96, and Sports & Recreation at $1.11.
The industries that saw the highest CPCs for the leads objective were Attorneys & Legal Services at $5.42, Dentists & Dental Services at $3.82, and Physicians & Surgeons at $3.63. While these were higher compared to the average, they’re still fairly low cost for clicks in these industries.
“The difference in CTR and CPC between the two objectives stands out to me the most. The average CPC is 56% lower for the traffic objective campaigns than that of the leads objective, which, in some ways, makes sense,” said Michelle Morgan, co-founder of Paid Media Pros.
“Facebook is trying to get the lowest cost clicks it can, but I’m a little surprised to see the CTR being 66% higher for the leads objective campaigns. That indicates to me that although they’re more expensive, the users Facebook targets with a leads objective campaign might actually be a better fit for companies (on average) than the traffic objective,” said Morgan.
Average conversion rate in Facebook ads for lead gen campaigns
Conversion rate measures the rate at which your Facebook ads are driving conversions. It’s calculated by dividing the total number of leads by the total number of clicks. A high conversion rate signals that your Facebook ad is compelling users to take the next step to potentially become your customer. A lower conversion rate signals you may need to adjust your ad targeting, copy, or landing page to drive better results.
The average conversion rate in Facebook ads for lead gen campaigns across industries is 8.25%.
| Business category | Avg. conversion rate |
| Arts & Entertainment | 9.77% |
| Attorneys & Legal Services | 5.92% |
| Automotive -- Repair, Service & Parts | 5.35% |
| Beauty & Personal Care | 4.61% |
| Business Services | 7.57% |
| Career & Employment | 7.02% |
| Dentists & Dental Services | 11.34% |
| Education & Instruction | 8.05% |
| Finance & Insurance | 5.62% |
| Furniture | 7.29% |
| Health & Fitness | 5.76% |
| Home & Home Improvement | 8.90% |
| Industrial & Commercial | 10.13% |
| Personal Services (Weddings, Cleaners, etc.) | 8.76% |
| Physicians & Surgeons | 4.99% |
| Real Estate | 9.58% |
| Restaurants & Food | 5.63% |
| Sports & Recreation | 8.24% |
| Travel | 3.95% |
The industries with the highest CVRs for Facebook ads running the leads objective were Dentists & Dental Services at 11.34%, Industrial & Commercial at 10.13%, and Arts & Entertainment at 9.77%.
The industries that saw lower-than-average conversion rates were Travel at 3.95%, Beauty & Personal Care at 4.61%, and Physicians & Surgeons at 4.99%.
Facebook ads conversion rates are usually dependent on the quality of the ads being put in front of users. “All industries can benefit from taking the time to message map in a meaningful way. Honoring the way your consumers want to be spoken to will increase conversion rates as well as mitigate ‘wasted success.’ Wasted success is when the lead is good but not quite ready or doesn’t qualify,” said Navah Hopkins, Evangelist at Optmyzer. “I strongly recommend building in a creative audit, as well as exploring new audience targeting to make sure your campaigns are set up for success,” said Hopkins.
Average cost per lead in Facebook ads for lead gen campaigns
Cost per lead tells you how much you’re paying to secure a new lead. It’s calculated by dividing your total spend by your total conversions.
The average cost per lead in Facebook ads for the leads objective across industries is $23.10.
| Business category | Avg. cost per lead |
| Arts & Entertainment | $13.46 |
| Attorneys & Legal Services | $78.26 |
| Automotive -- Repair, Service & Parts | $58.56 |
| Beauty & Personal Care | $52.46 |
| Business Services | $22.65 |
| Career & Employment | $18.17 |
| Dentists & Dental Services | $29.08 |
| Education & Instruction | $27.94 |
| Finance & Insurance | $30.88 |
| Furniture | $29.08 |
| Health & Fitness | $60.95 |
| Home & Home Improvement | $20.49 |
| Industrial & Commercial | $37.71 |
| Personal Services (Weddings, Cleaners, etc.) | $19.49 |
| Physicians & Surgeons | $60.95 |
| Real Estate | $12.43 |
| Restaurants & Food | $45.15 |
| Sports & Recreation | $15.33 |
| Travel | $26.05 |
The industries with the lowest CPLs in the Facebook leads objective were Real Estate at $12.43, Arts & Entertainment at $13.46, and Sports & Recreation at $15.33.
The industries that saw the highest CPLs for the leads objective were Attorneys & Legal Services at $78.26, Health & Fitness at $60.95, and Physicians & Surgeons at $60.95. These industries typically have higher costs for advertising, in general, but also have higher customer values. So a $60 CPL can still have a great return on investment when you look at how much revenue a new customer can bring your business.
While CPL is a critical metric for many Facebook advertisers, there are other factors you’ll want to consider when measuring your Facebook ads progress.
“The most important metric on Facebook for seeing success is…the metric you define as success. If you’re trying to drive engagement, that’s your metric. If you’re trying to drive leads, then some combination of lead volume and CPL is going to be your success metric,” said Morgan.
How to improve your Facebook ads performance
While these benchmarks can serve as a helpful guidepost to compare your results against, they shouldn’t be the end-all-be-all for measuring your Facebook advertising success. Every business is different, and what defines success for your campaigns will be unique to your business needs, budget, and other factors.
However, if you feel like your Facebook ads are not converting or driving traffic as much as they should when compared to industry averages, you’re not alone. There’s always room to improve—especially by following these tips and best practices.
How to use Facebook ads to drive traffic
Here are some tips on how to increase traffic to your website via your Facebook ads:
- Choose the traffic objective. The traffic objective is the clear choice to encourage Facebook’s ad algorithm to strategically show your ad to get the most clicks possible.
- A/B test CTA buttons. A powerful call to action can entice users to click on your Facebook ad—increasing your click-through rate. Luckily, Facebook gives you plenty of options to play around with when it comes to choosing an effective CTA button for your ad. Your best bet is to A/B test a few different CTA buttons to see what works. Additionally, you should include popular call-to-action phrases in your ad copy.
- Use compelling creative. People will form an opinion on your Facebook ad instantly—just a few seconds after seeing it, in fact. Be sure your ads stand out and attract clicks with eye-catching creative. To start, check out these Facebook ad examples and learn why they work.
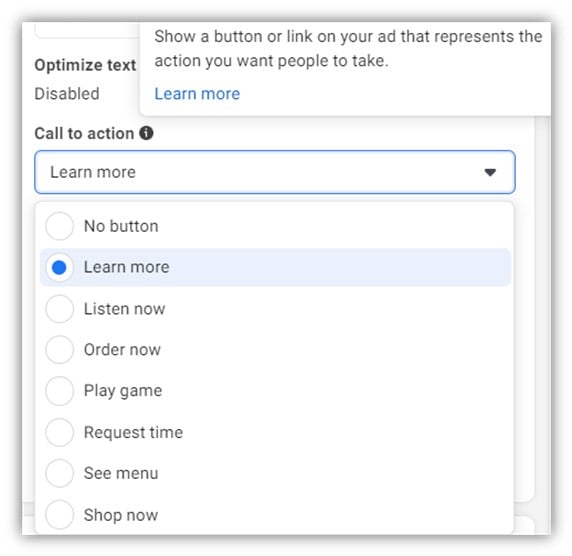
An example of the CTA button options within Facebook ads.
🌱 Find more tips to grow your business with Facebook Ads using our free guide on effective Facebook ads strategies!
How to use Facebook ads to drive leads
Follow these Facebook ads tips to get more leads:
- Choose the leads objective. While other Facebook ads campaign objectives may end up capturing leads, it’s best to source your leads directly from Facebook with Facebook lead ads.
- Perfect your form fields. You may need to test to see what form style works best to maximize both lead quality and quantity. For example, this year Meta announced that it added conditional logic to the Facebook lead generation form setup. Leveraging conditional logic in your forms can help you pre-qualify your leads.
- Ensure users know they are clicking on a lead ad. Be clear about the action you want viewers to take. That way, those who click know what to expect and genuinely want to work with your business.
An example of conditional logic settings within a Facebook Lead Ad.
How to improve your Facebook ads CTR
Here are a few ways to improve your Facebook ads CTR:
- Pay attention to the right metrics. CTR may not always be the “end all be all” Facebook ads metric for your business. “Consider CTR a helpful guide, but not the only source of truth for success,” said Mask. “Also, you might find other metrics impact the root causes of poor CTR health. Cost per thousand impressions (CPM) and CPC correlate closely to this metric; sometimes one has to be sacrificed for another.”
- Use power words in your copy. Emotional marketing copy can set your business’s Facebook ads apart from the competition. Focusing on compelling ad copy helps to persuade users to click on your ad—increasing your CTR.
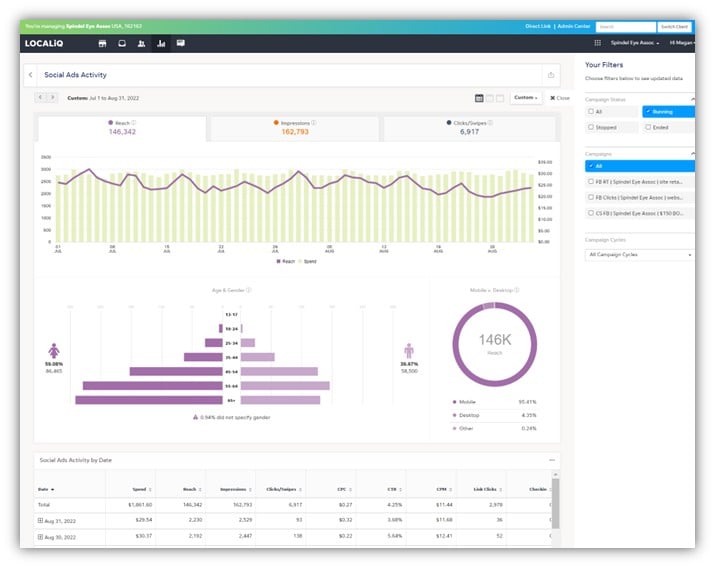
A reporting dashboard like this can help you measure the Facebook ad metrics that matter most to your business.
How to lower your Facebook ads costs
Here are some practical ways to lower your costs in Facebook Ads:
- Get strategic with your audience targeting. You may want to target different Facebook audiences for different objectives. For example, you may target a Facebook lookalike audience with a traffic objective, so you can educate a new crop of potential customers about who you are and what you do. Alternatively, you may target specific email addresses or retarget users while using the leads objective because these audiences are already aware of your business and may be more likely to convert.
- Broaden your audience as needed. A broader audience reach has been found to lower your overall cost per thousand impressions (CPM), since you’re casting a wider net.
- Try ad scheduling with a lifetime budget. Ad scheduling is another option that can help limit your costs, since you’re deciding what days or times your ad will show rather than 24/7 coverage.
- Consider all your campaign objective options. If you have experience with Google Ads, you can think of your Facebook campaign objectives like how you would your Google campaign goals and bidding strategies. “The best part about advertising on Facebook is that Facebook has tons of campaign objectives and further customizations for you to choose from to ensure your campaigns are optimizing for exactly the success metric you want to focus on,” said Morgan.
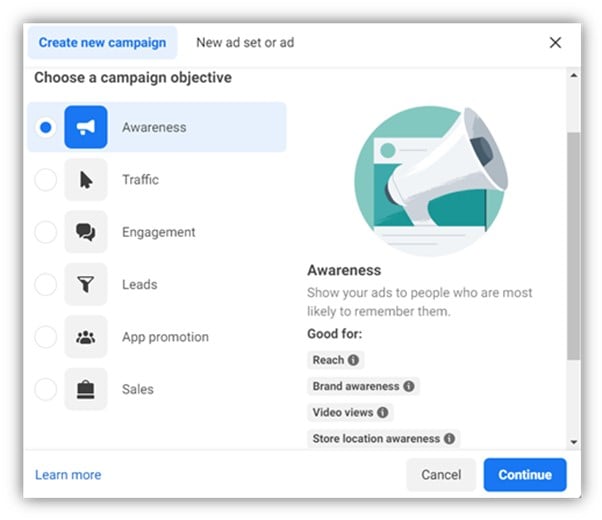
Here's a breakdown of the Facebook ad objectives you can choose from:
-
- Leads
- Traffic
- Awareness
- Engagement
- App promotion
- Sales
How to increase your Facebook ads conversion rate
Use these tips to optimize your Facebook ads for more conversions and a higher CVR:
- Iron out your tracking with Facebook pixel. Your Facebook ads conversion tracking relies on your Facebook pixel—which connects to your website. Get clear on the conversion actions you want to track to stop conversion data from slipping through the cracks.
- Optimize your landing page. A high conversion rate starts with an optimized landing page. Check that your Facebook ads landing page provides a seamless experience for users.
- Complement your strategy with other channels. Your Facebook ads should play a role in a larger marketing and advertising strategy for your business. Be sure to regularly share organic posts to Facebook to fill any gaps in your paid Facebook ad performance. You’ll likely want to also leverage other social media platforms, as well as channels like SEO and search ads, to supplement your Facebook Ads. For example, your audience members are probably using TikTok and Snapchat in addition to Facebook or Instagram. You could promote your business across these platforms to grow your overall social following. In fact, many marketing channels provide similar benefits to businesses, so it’s best to use as many as possible in tandem for a holistic marketing approach.
A cross-channel marketing campaign that includes social ads, search, and other channels helps you reach your audience no matter where they're spending time online. But it can be a very manual and challenging process to truly optimize across those channels to yield the desired results and lowest cost," said Stephanie Asrymbetov, Director of Product at LocaliQ. "LocaliQ's cross-media optimization (XMO) technology simplifies this approach by leveraging AI and automation to optimize your campaigns across channels based on what's driving the best performance to your business's goals—and your budget.”
Put these Facebook ads benchmarks to work in 2024
Tracking your Facebook ad performance against these industry benchmarks can help you gauge how your business is pacing compared to the competition. This can be especially helpful when you don’t have a ton of data or you’re unsure of how to best measure your Facebook ads ROI.
However, every business is unique, and no two Facebook ad accounts are the same. So, be sure to align your advertising expectations with what’s achievable for your business. That said, if you tried our suggested tips above and still find your business’s performance isn’t up to the industry standards outlined here, that’s okay! See how our solutions can help you improve your Facebook ads strategy.

Meet The Author
Susie Marino
Susie is the Senior Content Marketing Specialist for WordStream and LocaliQ, where she uses her experience as a PPC consultant to share tips, tactics, and best practices in the ever-evolving marketing and advertising space. Susie’s work has been featured in publications such as Search Engine Land, MediaPost, Social Media Today, and others. Outside of work, Susie loves to get outside for some snowboarding or (once the cold weather melts away) hiking!
![How to Run Watch-Worthy Facebook Video Ads [Complete Tutorial]](https://www.wordstream.com/wp-content/uploads/2026/03/facebook-video-ads-feature-image.jpg)