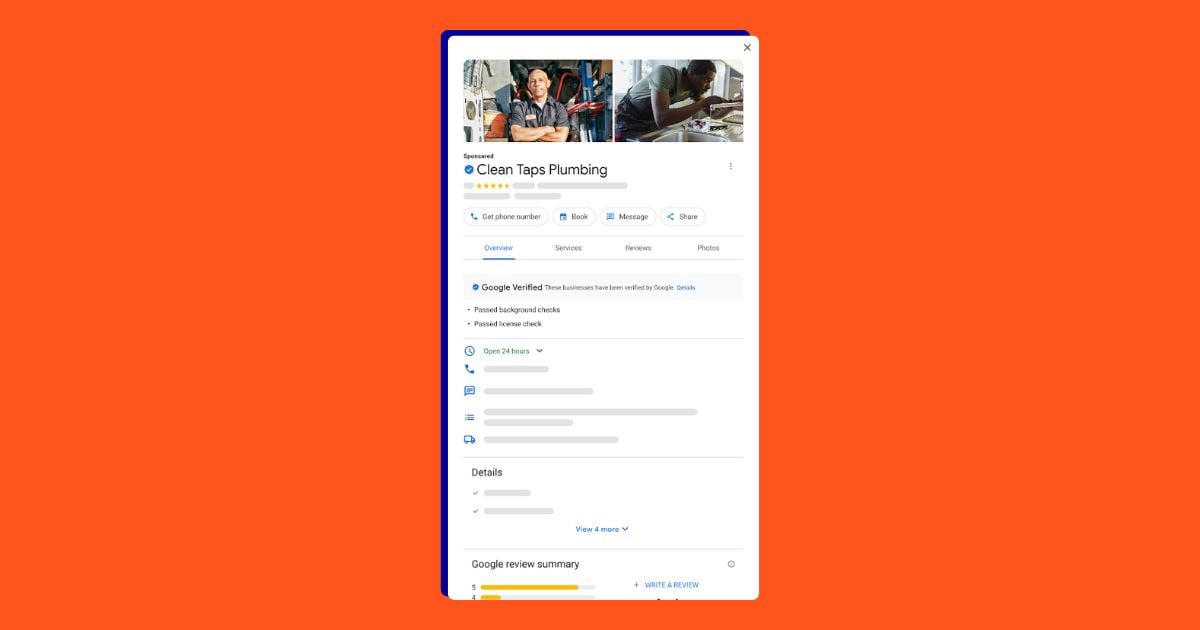
It’s no secret that one of the most effective ways to promote your business online is through search ads. In fact, when correctly optimized, pay-per-click (PPC) advertising returns $2 for every $1 spent—a 200% ROI—on average.
But how do you know your search campaigns are optimized to their fullest capacity? When you have advertising money on the line, you need to have confidence that your campaigns are performing at a rate that’s viable for your business.
Wouldn’t it be nice to just peek inside your competitors’ accounts to know for sure how you compare? While that isn’t currently possible, we’ve brought you something even better.
We analyzed 17,253 US-based search advertising campaigns running between April 1, 2022, and March 31, 2023, to create in-depth search advertising benchmarks for 23 industries. These search ad benchmarks are primarily Google Ads based, but they do account for Microsoft Ads as well since the data is about 80% from the former and 20% the latter.
“We’re extremely excited to release and share these search advertising benchmarks,” said LocaliQ Chief Sales Officer Jon Camerata. “Between inflation rising at record levels, increased competition, and economic uncertainty, it’s more important than ever to understand how your search campaigns are performing. When done right, search advertising can be a powerful tool for your business. We hope these benchmarks help you feel more confident in the decisions you make to maximize your search advertising success.”
Without further ado, we introduce our 2023 Google Ads benchmarks!
🛑 Want the newest data? Get our 2026 Google Ads Benchmarks report here.
Table of contents
Click to jump to a specific section in our report:
- Key trends: the big picture
- Microsoft and Google Ads benchmarks for every industry
- Average click-through rate
- Average cost per click
- Average conversion rate
- Average cost per lead
- What these search ads benchmarks mean for your business
Search ads benchmarks: key trends
While there are tons of ways to slice and dice this data, let’s first zoom out to look at the big picture.
(Get the 2026 search ads benchmarks data here!)
Here are the key trends you need to know:
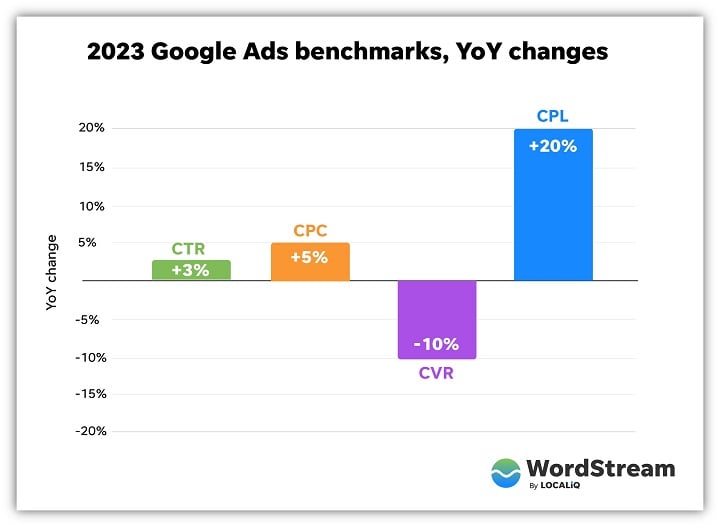
- Click-through rate (CTR) increased YoY for 21 out of 23 industries. While Business Services and Industrial and Commercial industries both saw decreases, they weren’t as significant as the increases other industries faced.
- Cost per click (CPC) increased year over year (YOY) for 14 industries. Meanwhile, it decreased for 8 industries and stayed the same for just one: Apparel, Fashion, and Jewelry. The fact that 61% of industries saw an increase and only 35% saw a decrease is not super surprising given our data showed that cost per click increased throughout 2022.
- Conversion rate (CVR) decreased YoY for most industries. In some cases, it went down significantly. All but two industries saw a downturn in their conversion rate, which were Beauty and Personal Care as well as Education and Instruction. So, 91% of industries saw an increase in CPL as well as a decrease in conversion rate.
- Cost per lead (CPL) increased YoY for all industries but two (Automotive Sales and Beauty and Personal Care). This means that 91% of industries saw an increase in how much it costs them to acquire a lead through search ads. This trend is mirrored in our 2022 data, but our latest updates for 2023 show that these increases YoY have slowed.
The overall takeaway from these trends? The search ads landscape is throwing more challenges our way. However, while navigating search ads might feel more difficult this year, it can also feel much more rewarding when properly executed.
“Clearly it’s been a challenging time for many industries as it relates to rising costs per lead. While CPCs rose only modestly, the drop in conversion rates has contributed to higher CPLs in almost all industries,” said Mitchell Leiman, Senior Vice President of Strategy and Operations at LocaliQ. “Despite these challenges, most advertisers have found when managing campaigns effectively, search advertising remains one of the best tools at their disposal.”
Search ads benchmarks for every industry
To start off our data deep-dive, here are the Microsoft Ads and Google Ads benchmarks together across industries for all four metrics:
Ready to take a closer look? Let’s go through a break-down of each metric:
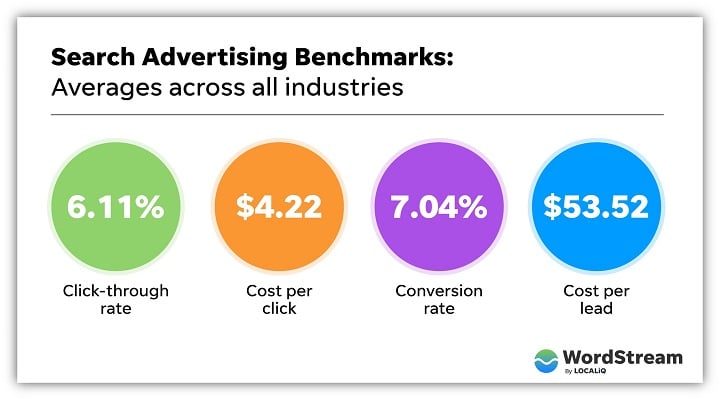
Average click-through rate in search ads
Your average click-through rate can be a very telling indicator when it comes to the efficacy of your search ad quality. A higher ad rank combined with enticing ad copy will likely draw more clicks—which is a major stepping stone to gaining conversions.
Your average click-through rate is calculated by dividing the total number of clicks by total number of impressions.
The average click-through rate in Google Ads in 2023 is 6.11%.
| Business Category | Avg. Click-Through Rate |
| Arts & Entertainment | 8.12% |
| Animals & Pets | 6.46% |
| Apparel / Fashion & Jewelry | 11.78% |
| Attorneys & Legal Services | 4.76% |
| Automotive -- For Sale | 8.77% |
| Automotive -- Repair, Service & Parts | 5.91% |
| Beauty & Personal Care | 6.87% |
| Business Services | 5.11% |
| Career & Employment | 6.67% |
| Dentists & Dental Services | 5.34% |
| Education & Instruction | 6.41% |
| Finance & Insurance | 6.18% |
| Furniture | 6.19% |
| Health & Fitness | 6.44% |
| Home & Home Improvement | 4.80% |
| Industrial & Commercial | 5.57% |
| Personal Services (Weddings, Cleaners, etc.) | 7.54% |
| Physicians & Surgeons | 6.73% |
| Real Estate | 9.09% |
| Restaurants & Food | 8.65% |
| Shopping, Collectibles & Gifts (General) | 6.39% |
| Sports & Recreation | 10.53% |
| Travel | 10.03% |
You’ll find the industries with the lowest click-through rates to be Attorneys and Legal Services at 4.76%, Home and Home Improvement at 4.80%, and Business Services at 5.11%.
In contrast, the industries with the highest click-through rates were Arts and Entertainment at 11.78%, Sports and Recreation at 10.53%, and Travel at 10.03%.
Average click-through rate: YoY
Here’s how click-through rates have changed in 2023 compared to 2022:
The industries that took the biggest hit to average click-through rates year over year were Business Services (down by 2.11%) and Industrial and Commercial (down by 1.94%).
Meanwhile, Sports and Recreation click-through rate increased by 17.65% year over year. Shopping, Collectables, and Gifts saw an increase of 15.55% year over year. Also, the Beauty and Personal Care click-through rate went up by 15.08% year over year.
How to improve your click-through rate
If your click-through rates are lower than average for your industry, don’t fret. You can improve your click-through rate quickly and easily by addressing your ad copy and targeting. Try to think outside of the box for any new angles you may have yet to try.
For example, are there ways you can work power words or emotional phrases into your ad copy to better resonate with your audience and entice them to click?
Alternatively, you might need to reassess the type of audience you’re going after. Think about your PPC keywords with the keyword intent top-of-mind. For instance, your Search Terms Report could indicate that you’re showing more for users seeking out information rather than looking to click and take an action.
Brought to you by
![]()
Ready to grow your business?
Unlock the results you’re looking for with technology-backed solutions designed for small businesses and agencies.
Average cost per click in search ads
Average cost per click in Google Ads or Microsoft Ads is calculated by dividing the overall amount a campaign spent by the number of clicks it received. Clicks are the bread and butter of any search campaign since you need ad viewers to click to your landing page to convert them to a customer.
Each individual click will have a different cost as it’s calculated in real-time by the Google Ads auction algorithms. So, average cost per click can be a guiding light when trying to determine your bidding strategy, ad copy, budget, and more.
Accounts that yield higher click-through rates tend to see lower costs per click as the number of clicks offsets the amount spent. However, other factors, like high competition within a given industry, prove that this isn’t always the case. Let’s see the range of costs per click across industries for 2023:
The average cost per click in Google Ads in 2023 is $4.22.
| Business Category | Avg. Cost Per Click |
| Arts & Entertainment | $3.13 |
| Animals & Pets | $2.72 |
| Apparel / Fashion & Jewelry | $1.55 |
| Attorneys & Legal Services | $9.21 |
| Automotive -- For Sale | $2.08 |
| Automotive -- Repair, Service & Parts | $3.06 |
| Beauty & Personal Care | $2.89 |
| Business Services | $5.47 |
| Career & Employment | $3.78 |
| Dentists & Dental Services | $6.69 |
| Education & Instruction | $4.10 |
| Finance & Insurance | $4.01 |
| Furniture | $2.77 |
| Health & Fitness | $4.18 |
| Home & Home Improvement | $6.55 |
| Industrial & Commercial | $4.35 |
| Personal Services (Weddings, Cleaners, etc.) | $3.90 |
| Physicians & Surgeons | $3.97 |
| Real Estate | $1.55 |
| Restaurants & Food | $1.95 |
| Shopping, Collectibles & Gifts (General) | $2.44 |
| Sports & Recreation | $1.77 |
| Travel | $1.63 |
The industries with the highest costs per click were Attorneys and Legal services at $9.21, Dentists and Dental Services at $6.69, and Home and Home Improvement at $6.55.
Meanwhile, the industries with the lowest costs per click were Arts and Entertainment as well as Real Estate—which were both at $1.55. Travel is close behind with a $1.63 CPC.
Average cost per click: YoY
Let’s see how the above cost per click numbers compare to last year’s data:
More industries saw an increase in cost per click this year (61%) than we saw last year (57%). The biggest increases year over year were in Personal Services (up in cost by 17.47%), Furniture (up 12.6%), and Real Estate (up 12.32%).
Alternatively, some industries significantly saved on cost per click this year versus last year. For example, Finance and Insurance had the steepest drop in cost per click with an 11.48% decrease. Likewise, average cost per click was down by 8.37% for Auto Sales and 7.60% for Dentists and Dental Services.
How to improve your cost per click
There are countless ways to lower your cost per click, so it’s all about finding what works for you and striking a balance in your optimization strategy. You don’t want to sacrifice quality clicks and conversions just to save a bit on your average CPC.
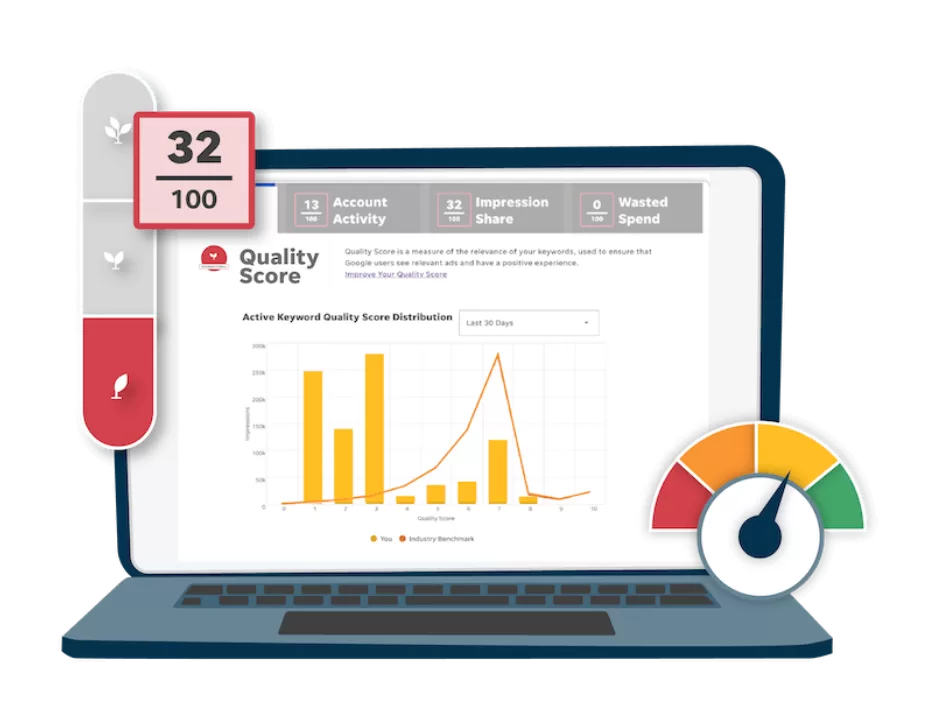
However, a good place to start is looking at your Quality Score. For example, if you offer a high-quality landing page experience and serve a highly relevant ad to your audience, Google is more likely to reward you with cheaper clicks since your ad is the best possible option to show to users.
You could also re-evaluate your bidding strategy. Certain strategies will cause you to pay more or less for a click depending on which goal you’re optimizing for. Check out our complete breakdown of the pros and cons of every Google Ads bidding strategy here.
PPC expert and Customer Success Manager at Google Alessandro Colarossi agrees that bidding can make a difference in your cost per click performance. “To improve your PPC results, consider utilizing machine learning-based bid strategies, such as Google's Target ROAS,” said Colarossi. “These advanced features of Google Ads harness the power of artificial intelligence to optimize your campaigns, allowing for more efficient targeting, bidding, and ad placement.”
Average conversion rate in search ads
Average conversion rate indicates how frequently your campaigns’ clicks turn into conversions. It’s calculated by dividing your total number of conversions by your total number of clicks.
Conversion rate can directly correlate with your business’s bottom line, since bringing in more conversions can offset your costs per lead.
“If I had to choose one metric that is most important for measuring success, I would say that the conversion rate is the most critical metric,” said Colarossi. “This metric provides insight into the effectiveness of a campaign in converting leads into customers, which is the ultimate goal of most PPC campaigns.”
“A high conversion rate means that a campaign is resonating well with its target audience, compelling them to take the desired action. Conversion rate provides the most direct insight into the success of a campaign in achieving its primary objective.”
The average conversion rate in Google Ads in 2023 is 7.04%.
| Business Category | Avg. Conversion Rate |
| Arts & Entertainment | 13.41% |
| Animals & Pets | 1.57% |
| Apparel / Fashion & Jewelry | 3.03% |
| Attorneys & Legal Services | 7.00% |
| Automotive -- For Sale | 5.72% |
| Automotive -- Repair, Service & Parts | 12.61% |
| Beauty & Personal Care | 8.16% |
| Business Services | 4.94% |
| Career & Employment | 3.11% |
| Dentists & Dental Services | 10.40% |
| Education & Instruction | 7.07% |
| Finance & Insurance | 4.11% |
| Furniture | 2.57% |
| Health & Fitness | 8.40% |
| Home & Home Improvement | 10.22% |
| Industrial & Commercial | 7.91% |
| Personal Services (Weddings, Cleaners, etc.) | 8.70% |
| Physicians & Surgeons | 13.12% |
| Real Estate | 2.88% |
| Restaurants & Food | 5.06% |
| Shopping, Collectibles & Gifts (General) | 3.69% |
| Sports & Recreation | 5.69% |
| Travel | 3.87% |
The three industries with the lowest average conversion rates were Apparel, Fashion, and Jewelry at 1.57%, Furniture at 2.57%, and Real Estate at 2.88%.
The three industries with the highest average conversion rates were Animals and Pets at 13.41, Physicians and Surgeons at 13.12%, and Automotive Repair, Service, and Parts at 12.61%.
Average conversion rate: YoY
Now, take a look at conversion rates year over year:
Average conversion rate decreased most significantly year over year for Arts and Entertainment (down 36.22%), Apparel, Fashion, and Jewelry (down 34.78%), and Career and Employment (down 32.04%).
However, Education and Instruction saw the highest increase in conversion rate year over year as it was up by 18.86%. Beauty and Personal Care followed behind with an increase in conversion rate of 10.76% year over year.
Elisa Gabbert, Director of Content and SEO at LocaliQ, isn't surprised by conversion rates decreasing, even with an increase in CTRs. "We've continued to see ads served for less commercial, more informational queries. This could lead to advertisers getting high CTRs but lower conversion rates because some of those searchers don't have conversion intent," she said.
"For example, you'll see multiple ads for a low-intent query like 'marketing ideas.' Especially on a SERP where the paid and organic results look almost exactly the same, you're going to see high ad CTR's due to placement but low conversion rates, because most of this audience just wants fast and free information."
This may be related to the fact that using broad match as the single match type in a campaign is becoming more and more prevalent across accounts—which gives advertisers less control over which queries their ads match against. To combat this, many advertisers are leaning into their Search Terms Reports and negative keyword lists to keep lower-intent traffic at bay.
How to improve your conversion rate
If you find your conversion rates are lower than your industry’s average, there may be more than one reason. First, let’s assume all your other PPC metrics, like click-through rate or average cost per click, are in line with industry averages. Of course, if you’re not pulling enough clicks, you’ll likely find your conversion rate numbers to be low too.
Next, take a look at your landing pages. Be sure that they’re optimized for mobile devices and follow key website accessibility guidelines. It’s also a good idea to step into your users’ shoes and test out your conversion flow. Are your desired actions clearly stated on the page and are they quick and easy to complete? Lastly, you could refresh your landing page copy to include more unique value propositions and powerful call-to-action phrases.
Once you know your landing pages are optimized to a T, you can look to other components of your Google Ads strategy, like your keywords, ad copy, and audience. If these three areas are not tightly aligned, there may be some intent mismatch between what you're offering and what your audience is looking for.
Jyll Saskin Gales, Google Ads Expert and Marketing Coach, says lower conversion rates aren’t as hair-raising as they might appear at first glance: “While a drop-in conversion rate sounds alarming, I don't think the takeaway is that Google Ads aren't working as well. In my coaching practice, I'm seeing business owners across industries coming to me with lower conversion rates over the last year, regardless of acquisition source. Business owners should check their website analytics to determine which channels have been most resilient and launch robust retention marketing tactics.”
Average cost per lead in search ads
Cost per lead is considered the “money metric” by many advertisers. That’s because it divides your total spend against your total number of conversions. Essentially, it’s telling you your “bang for your buck” when it comes to PPC advertising.
The average cost per lead in Google Ads in 2023 is $53.52.
| Business Category | Avg. Cost Per Lead |
| Arts & Entertainment | $23.57 |
| Animals & Pets | $72.24 |
| Apparel / Fashion & Jewelry | $76.71 |
| Attorneys & Legal Services | $111.05 |
| Automotive -- For Sale | $42.52 |
| Automotive -- Repair, Service & Parts | $21.12 |
| Beauty & Personal Care | $36.97 |
| Business Services | $87.36 |
| Career & Employment | $132.95 |
| Dentists & Dental Services | $65.37 |
| Education & Instruction | $62.80 |
| Finance & Insurance | $90.02 |
| Furniture | $108.85 |
| Health & Fitness | $51.42 |
| Home & Home Improvement | $66.02 |
| Industrial & Commercial | $59.74 |
| Personal Services (Weddings, Cleaners, etc.) | $40.85 |
| Physicians & Surgeons | $37.71 |
| Real Estate | $66.02 |
| Restaurants & Food | $34.81 |
| Shopping, Collectibles & Gifts (General) | $31.50 |
| Sports & Recreation | $31.82 |
| Travel | $62.18 |
The industries with the highest cost per lead were Career and Employment ($132.95), Attorneys and Legal Services ($111.05), and Furniture ($108.85).
The industries with the lowest cost per lead were Automotive Repair, Services, and Parts at $21.12, Animals and Pets at $23.57, and Shopping, Collectibles, and Gifts at $31.50.
Average cost per lead: YoY
We know average cost per lead is up for most industries this year, but here’s how that trend compares to last year:
The biggest increases in CPL year over year were in the industries of Career and Employment (up by 52.19%), Arts and Entertainment (up by 49.18%), and Real Estate (up by 46.22%).
This isn’t surprising given the state of the economy. “The recent rise in interest rates is impacting several industries' digital campaigns. Interest rates are the highest they've been since 2008—but the digital landscape in 2023 is incomparable to the last time advertisers were campaigning with high interest rates,” said Mark Irvine, Director of Paid Media at SearchLab. “The biggest purchases a typical consumer makes, like real estate, finance, and education, are decisions that are often motivated and financed by loans. These aren't trivial decisions, and consumers are going to spend more time researching and comparing options in these industries.”
As for the biggest decreases in cost per lead year over year, Auto Sales wins out with a decrease of 8.62%, followed by Beauty and Personal Care at 3.90% lower CPL than last year.
How to improve your cost per lead
To lower your Google Ads cost per lead, you’ll want to first look at your cost per click since that has a direct correlation with how much an individual conversion might cost you. Another component of your cost per lead is your conversion tracking strategy. The more actions you have available on your website for users to complete, the more conversions you’ll likely pull to offset your overall lead costs.
It’s also important to remember that cost per lead isn’t the most important way to measure the effectiveness of your search advertising campaigns. “While cost per lead is an important metric we optimize for to help offset increases in this period of inflation for our clients, it is also important to consider quality of leads,” said LocaliQ Vice President of Media Delivery & Automation Devon Anderson.
You might find that you have a high cost per lead but that those leads are valuable for your business, so they're worth the spend.
What these search ads benchmarks and trends mean for your business
How can you turn this data into action items for your account? Here are the key takeaways from our report:
1. Budgets need to flex to compete
With both average costs per lead and costs per click having gone up in the last year for the majority of industries, it’s no secret that stretching a smaller Google Ads budget is getting increasingly more difficult.
To keep up with rising costs, advertisers will need to spend money to make money this year. While it’s not always feasible to add more marketing budget to your Google Ads or Microsoft Ads campaigns, there are ways you can work smarter, not harder, when it comes to budgeting.
Budget flexibility can be a pathway to cost per click and cost per lead success. If you stay ready to re-allocate campaign budget based on your unique needs and niche market trends, you’ll be able to remain competitive. Basically, you want to squeeze the most out of the campaigns that are working for your business instead of against it.
LocaliQ Vice President of Client Success Stephanie Scanlan stresses the importance of proper budgeting. “You can have an amazing website that converts well, a tailored keyword list, and great text ads, but if you don’t have the correct budget to show properly in the auction, your campaign will never succeed,” she said.
“You need budget to be able to get impressions needed to convert, bid correctly on your keywords, and sustain through your peak times of the day. Everything else doesn’t matter if you aren’t able to compete in the auction.”
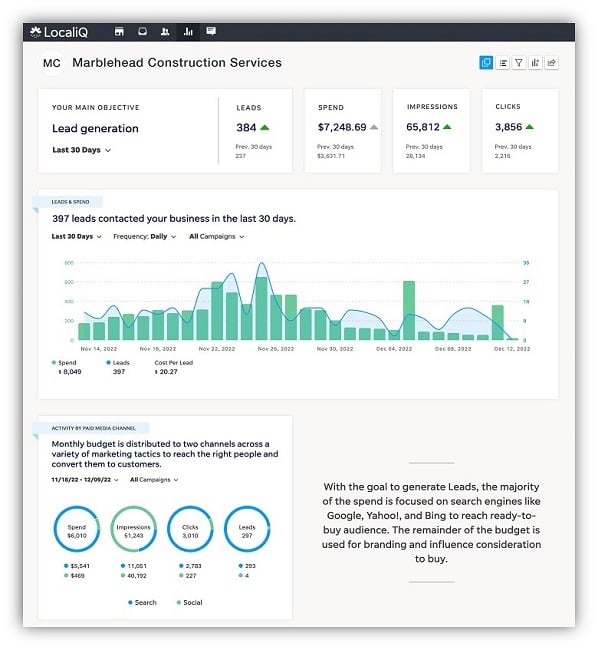
To keep your budget strategy nimble, try using a spend-tracking tool. For example, the Google Ads budget report or the LocaliQ Marketing Dashboard (shown below) can help you see how your budget is pacing across campaigns.
2. The customer’s search journey is rapidly changing
Due to the average conversion rate decreasing for 91% of industries, it’s safe to say that the buyer’s journey is evolving. Consumers are likely more conscious of economic factors like inflation and, in turn, put more thought behind their buying decisions. This is likely why we’re seeing lower conversion rates even though click-through rates have increased almost universally year-over-year.
“Search advertisers need to be attuned to the real-world implications of what their prospects are searching for, even if their keywords haven't changed in the past year. This will be the first time for most advertisers that costs will extend much longer past their first ad impression,” said Irvine.
Plus, today’s digital landscape allows users to interact with your business across multiple channels before they convert. Meaning search advertising may be helping capture searchers at the top of the funnel before they’re ready to purchase while other strategies move them closer to conversion.
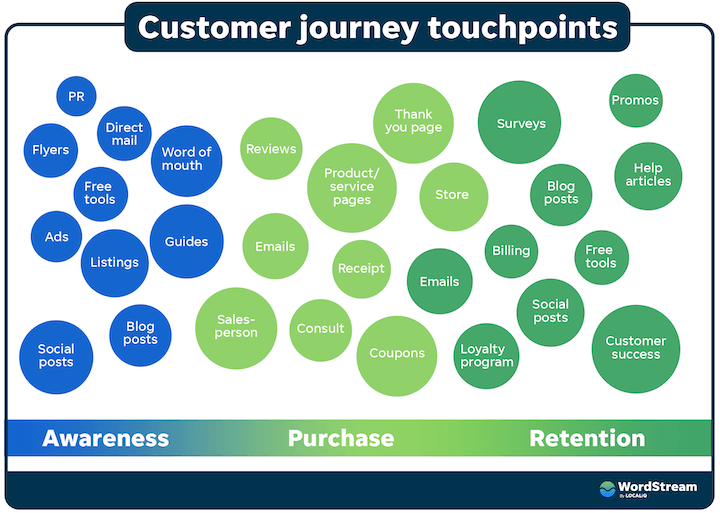
Advertisers should consider how their Google Ads strategy could be integrated into all these possible touchpoints.
If you’re not already incorporating search into a cross-channel strategy, now is the time to do so. “Search advertising is most effective as part of a more comprehensive full-funnel marketing strategy,” said Leiman.
Knowing your buyer’s behavior and adjusting your Google Ads strategy accordingly, is something that PPC expert Navah Hopkins, Evangelist at Optmyzr, recommends as well.
“My top tip is to do the work of building out buyer personas and aligning campaigns to them. That means using audience exclusions because audiences are now baked into broad match,” said Hopkins.
“Additionally, we need to invest time in crafting creative for all stages of the funnel (including display and video). Not everyone will want to consume content through text and forcing that is leaving money on the table.”
Irvine also suggests trying additional strategies for search campaigns. “Advertisers may want to consider leveraging a remarketing audience or custom-intent audience to better refine their ads for users who are genuinely likely to convert.”
3. New additions to search campaigns have resulted in highly clickable ads
Since we saw an increase in click-through rate for nearly every industry, we know people are more inclined to click on ads than ever before.
Considering platform updates like responsive search ads as the default ad type for search campaigns, additional ad assets now available, and more, the quality of ads on the SERP has increased. These factors, possibly combined with how well ads blend into the organic results in Google’s latest interface, make ads more enticing for users to click on. To keep up, search advertisers should be focusing on highly-optimized ad copy as well as leveraging multiple ad assets. This will enhance your ad to keep up with competition.
Saskin Gales also finds new ad formats to have had an impact on CTR. “An across-the-board increase in click-through is impressive, as it suggests that advertisers are doing a better job of serving engaging creative to relevant audiences–likely thanks to more automated solutions like Performance Max and dynamic search ads,” she said.
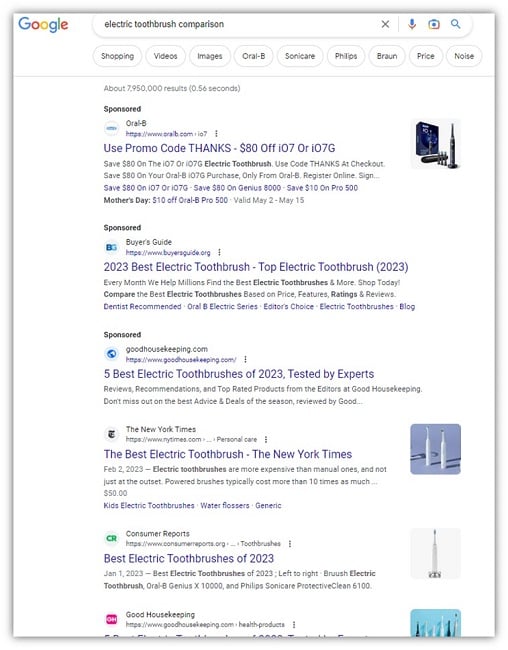
The bold sponsored text is currently the only thing differentiating ads from organic results. To the untrained eye, someone who usually avoids ads might be more inclined to click thinking that the ad is a high-quality organic result.
4. Tracking and reporting are crucial
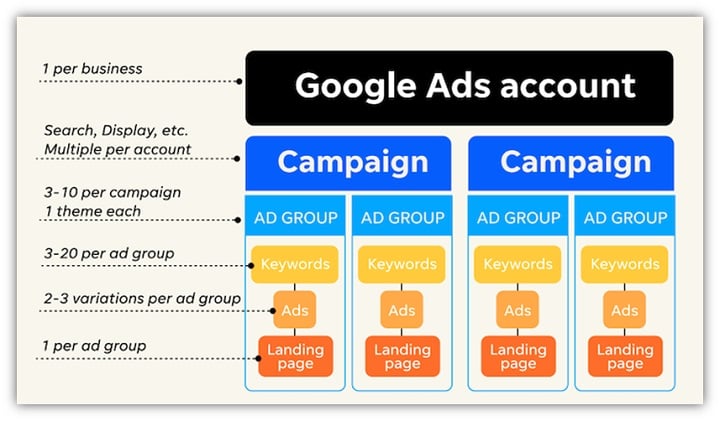
One final key point that stands out in this report is how important your Google Ads reporting and tracking can be to your overall success. Staying on top of benchmarks like these is vital to understand key trends within your industry. But benchmarking your own progress so you can accurately evaluate your business’s performance against the competition is also crucial.
Brett McHale, Paid Media Marketing Expert and Founder of Empiric Marketings stresses the importance of tracking the performance metrics that matter most to your business. “Every metric is there for a reason; they all contribute to delivering a clear picture of the health of your PPC performance. You can have a high cost per click but an optimal lead cost because your conversion rate is great. This shows that optimizing for the right metrics for your business can pay off substantially from a strategic perspective," he said.
“My top tip for improving PPC results is to focus on how you structure the account and campaigns around your goals. Focus on the metrics that are most aligned with your PPC advertising goals and structure your ad account to maximize the performance of those metrics.”
Scanlan also mentions how benchmarks reports like this one combined with your own account’s performance and goals can help you make data-backed marketing decisions. “Metrics are an important gauge for optimizing your search campaign and give you the roadmap to make changes that deliver you ROI,” said Scanlan. “However, the metrics shouldn’t be your only focus and achievement because a good cost per click and click-through rate in their own vacuum don’t mean you are getting the ROI you want from your search campaign. That being said, these metrics are great guidelines to help you during your optimizations.”
Colarossi agrees. “In digital marketing, cost per click, click-through rate, conversion rate, and cost per lead are all crucial metrics that allow you to gauge the effectiveness of your ad campaigns. By tracking these metrics, you can identify which ads are generating the most clicks, leads, and conversions, and adjust your strategies to optimize performance. When you monitor your performance and optimize for these metrics, you can increase the efficiency and ROI of your campaigns, and ultimately achieve your business goals more effectively,” he said.
Make the most of these Microsoft and Google Ads search advertising benchmarks
While these benchmarks can act as a helpful starting point when your strategy needs a facelift, know that there’s no right or wrong answer to how you decide to promote your business on Google or Microsoft. Every advertiser’s account is unique and will look different from the next.
However, when you’re pressed to maximize your search advertising ROI, benchmarks like these can help lead the way. If this data made you feel like your account could use some TLC, that’s completely normal. Like with anything in marketing, there’s always room for improvement. By following our best practices and recommendations here, you can uncover your campaign’s untapped potential. Plus, if you still feel stuck on a specific metric or optimization struggle, know that our digital marketing solutions are always available to help you make the most out of your search advertising!
About the data
This report is based on 17,253 US-based search advertising campaigns running between April 1, 2022, and March 31, 2023. Each industry category includes a minimum of 89 unique LocaliQ campaigns. Averages are technically median figures to account for outliers.

Meet The Author
Susie Marino
Susie is the Senior Content Marketing Specialist for WordStream and LocaliQ, where she uses her experience as a PPC consultant to share tips, tactics, and best practices in the ever-evolving marketing and advertising space. Susie’s work has been featured in publications such as Search Engine Land, MediaPost, Social Media Today, and others. Outside of work, Susie loves to get outside for some snowboarding or (once the cold weather melts away) hiking!
Recommended for you


![Search Advertising Benchmarks for Your Industry [Report]](https://www.wordstream.com/wp-content/uploads/2024/04/RecRead-Guide-Google-Benchmarks.webp)