Search advertising still reigns as one of the most popular digital marketing channels for small businesses in 2025. In fact, according to our recent marketing trends survey, 76% of small businesses report being satisfied with their search advertising tactics, and almost half of SMBs are planning to invest more in search advertising this year.
But where does your business land—are you ready to increase your investment, or still questioning the effectiveness of your existing search ad campaigns? With increasing changes to the search engine results page, like AI Overviews and the potential for multiple ads from the same brand, coupled with increasing advertising costs year over year, it can be tough to know. However, it’s important to understand how your search ads are performing compared to competitors in your industry so you can make informed decisions about how to optimize your campaigns.
Luckily, it’s that time of year once again for our annual search ads benchmarks! We analyzed over 16,000 campaigns running from April 2024 through March 2025 to create an easy-to-use report that paints a picture of how businesses in your industry are performing on Google Ads and Microsoft Ads.
We’re also including thorough analyses, expert advice, and actionable tips to help you take control of your accounts and maximize your search ads strategy.
🛑 Want the newest data? Get our 2026 Google Ads Benchmarks report here.
Contents
- Key search ads trends: The big picture
- Microsoft and Google Ads benchmarks for every industry
- Average click-through rate
- Average cost per click
- Average conversion rate
- Average cost per lead
- What these search ad benchmarks mean for your business
Key search ads trends: The big picture
(Get the 2026 Google Ads benchmarks data here!)
Search advertising costs have been increasing year over year for the last five years, and our latest data shows this trend continuing. However, cost per lead did not increase as drastically in 2025 as it did from 2023 to 2024, suggesting a little more stability in the paid ad space (after an extremely volatile year for organic rankings).
Let’s take a look at the big picture of this benchmark data before we get into the metric-by-metric details.
- Overall, average click-through rate (CTR) increased slightly, by 3.74%, but when broken down by industry, just over half of the industries saw a decrease in CTR YoY, while 48% saw either stable or increased CTRs. This is a departure from our findings over the last two years, where CTR increased pretty significantly for many industries. Google and other search engines have continuously optimized ad placements to better blend in with organic results, but they may have done all of the optimizations they can do (for now), which speaks to increased costs and lower click-through rates (for 52% of industries).
- Cost per click increased for 87% of industries. Some industries, like Education & Instruction and Beauty & Personal Care, saw substantial increases (over 40%). This is in line with our data last year, where we saw cost per click (CPC) increase for 86% of industries. The continuing increase in costs is likely due to crowded and unstable SERP conditions, plus increased competition.
- Conversion rate increased for 65% of industries. It’s not all bad news! 15 out of 23 of the industries we looked at saw increases in conversion rate (CVR) YoY. This comes after a decrease for most industries last year. Some industries, like Sports & Recreation and Education & Instruction, saw large increases (over 40%). It’s encouraging to know that despite rising costs, search ads are still effective at driving leads for businesses. This could be due to a more stable economy throughout 2024.
- Cost per lead increased for 13 out of 23 industries, although the average increase was only around 5% YoY, noticeably lower than last year’s 25% average increase. However, some industries did see significant decreases, including Career & Employment (46.74%) and Arts & Entertainment (32.28%). An increase in cost per lead (CPL) isn’t surprising given lower CTRs in those industries and increased CPC.
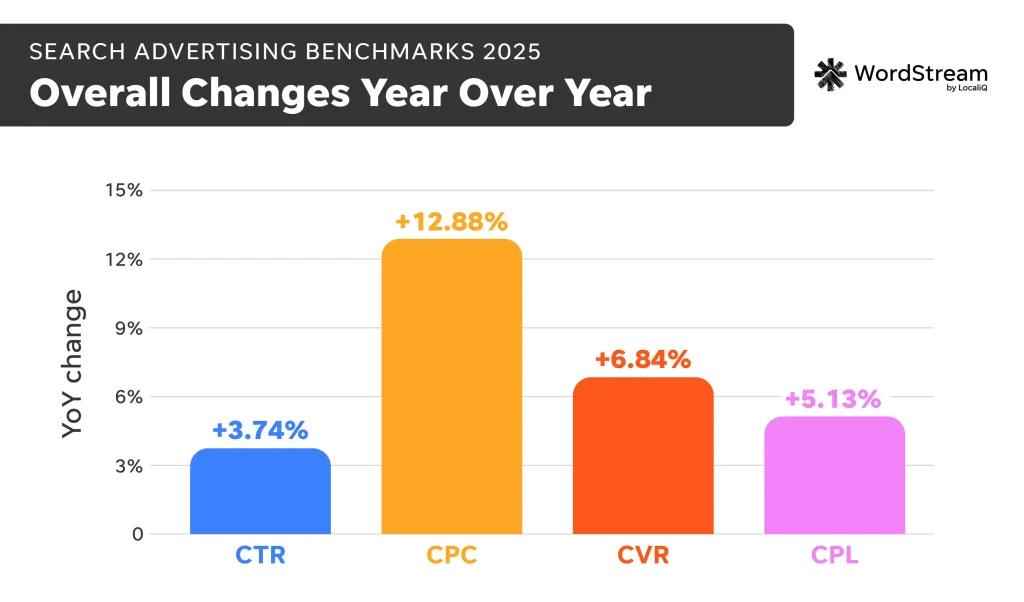
Although costs have gone up, so have click-through rates and conversion rates, indicating generally better performance for advertisers as a whole.
According to Cliff Sizemore, Senior Marketing Manager at LocaliQ, “Costs are rising, but so is performance—65% of industries saw better conversion rates in 2025. The main takeaway here is that a smart strategy beats cheap clicks.”
Microsoft and Google Ads benchmarks for every industry
Ready to dig into the latest PPC trends? Check out the Microsoft and Google Ads benchmarks across all metrics and industries for 2025 below.
🚨 Want the full (most up-to-date) data breakdown straight to your inbox? Download our free Google Ads benchmarks guide!
Average click-through rate in search ads
While click-through rate isn’t necessarily a “money metric” that ties back directly to your spend, it’s still important to your overall campaign health and ROI. It tells you how clickable your ads are, which you want to prioritize when trying to pull potential customers from the busy SERP.
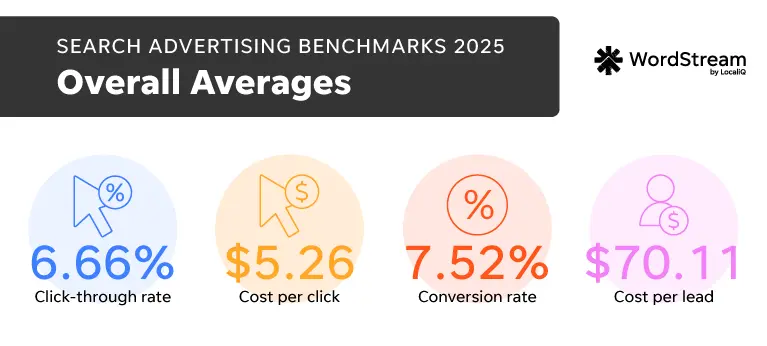
The average click-through rate in Google Ads in 2025 is 6.66%.
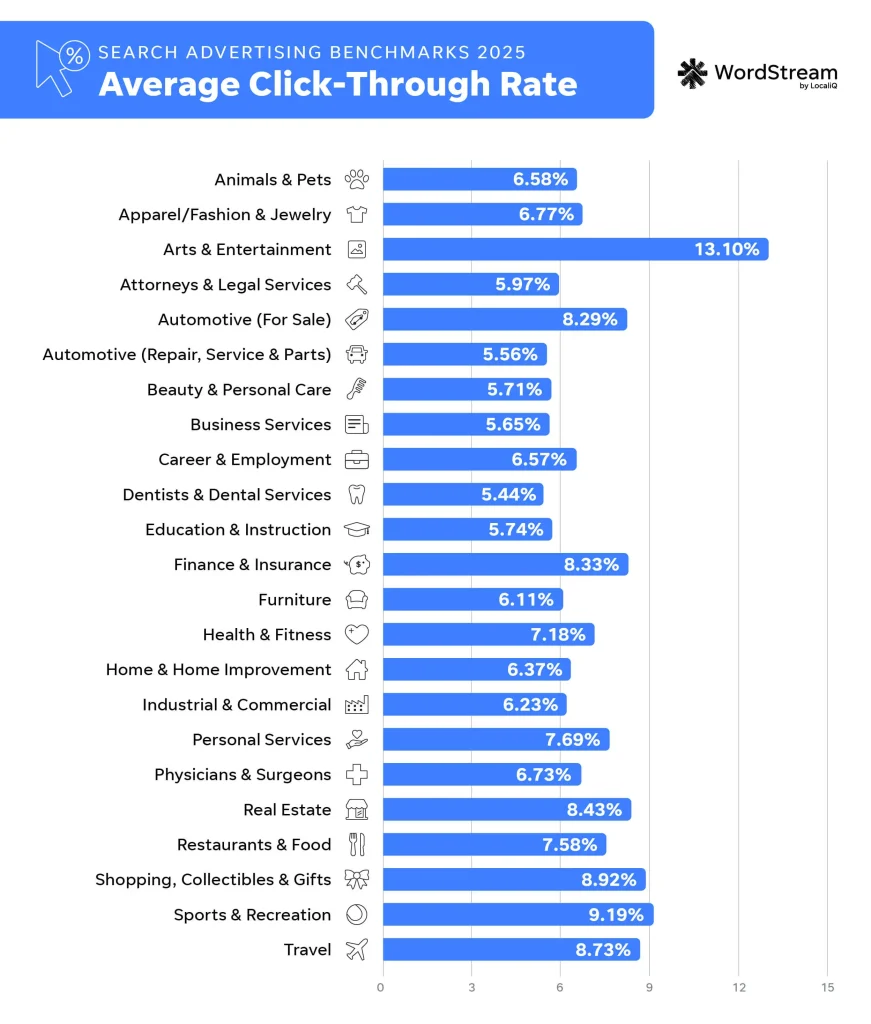
| Business Category | Average CTR |
| Animals & Pets | 6.58% |
| Apparel / Fashion & Jewelry | 6.77% |
| Arts & Entertainment | 13.10% |
| Attorneys & Legal Services | 5.97% |
| Automotive — For Sale | 8.29% |
| Automotive — Repair, Service & Parts | 5.56% |
| Beauty & Personal Care | 5.71% |
| Business Services | 5.65% |
| Career & Employment | 6.57% |
| Dentists & Dental Services | 5.44% |
| Education & Instruction | 5.74% |
| Finance & Insurance | 8.33% |
| Furniture | 6.11% |
| Health & Fitness | 7.18% |
| Home & Home Improvement | 6.37% |
| Industrial & Commercial | 6.23% |
| Personal Services | 7.69% |
| Physicians & Surgeons | 6.73% |
| Real Estate | 8.43% |
| Restaurants & Food | 7.58% |
| Shopping, Collectibles & Gifts | 8.92% |
| Sports & Recreation | 9.19% |
| Travel | 8.73% |
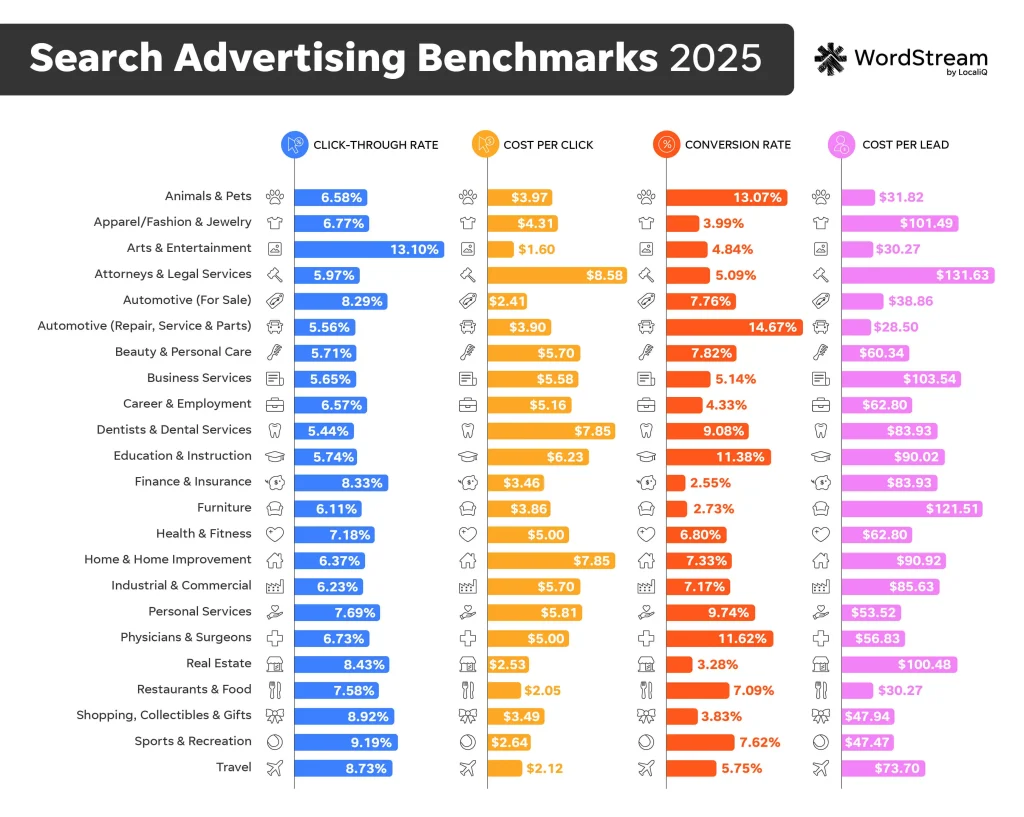
The industries with the highest average click-through rates were Arts & Entertainment at 13.10%, Sports & Recreation at 9.19%, and Shopping, Collectibles, & Gifts at 8.92%.
The industries with the lowest average click-through rates were Dentists & Dental Services at 5.44%, Automotive—Repair, Services, & Parts at 5.56%, as well as Business Services at 5.56%.
Average click-through rate: YoY
While the overall average click-through rate increased year over year, the industries that saw the biggest decreases year over year were Beauty & Personal Care (down 15.41%), Travel (down 14.07%), and Restaurants & Food (down 12.67%).
In contrast, the industries with the highest increases year over year included Shopping, Collectibles & Gifts up 14.07%, Home & Home Improvement up 13.95%, and Attorneys & Legal Services up 12.64%.
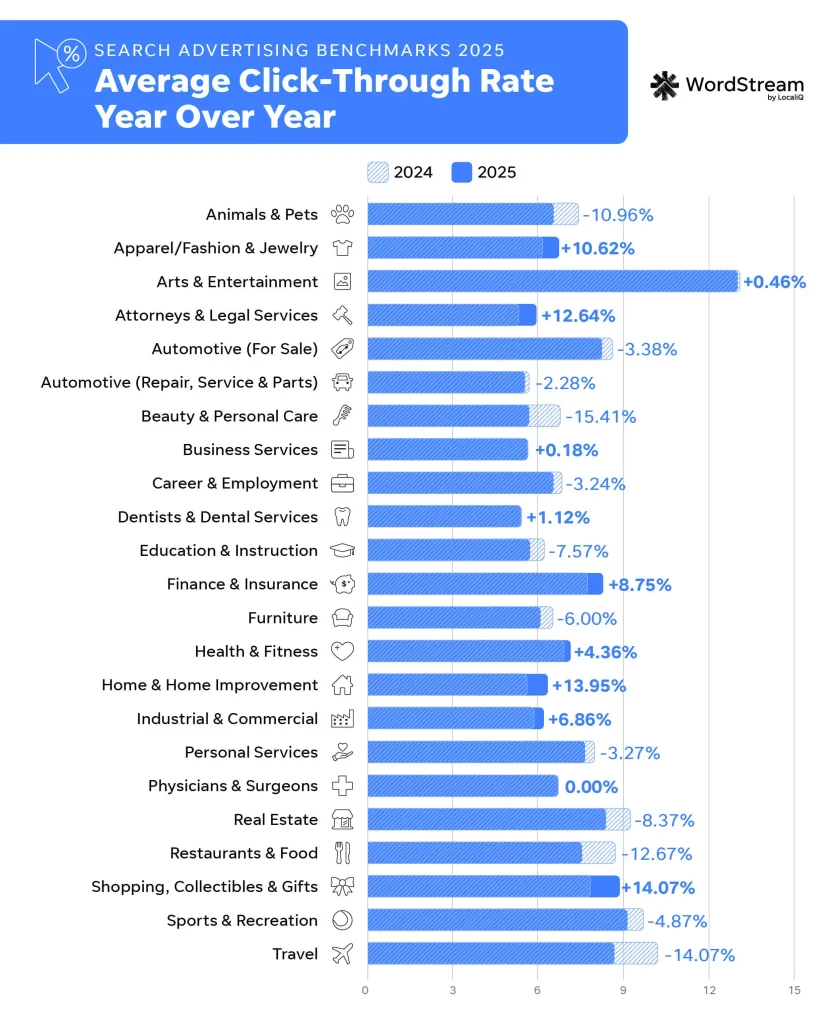
The overall average click-through rate across all industries increased 3.74% year over year. We think there could be a few SERP factors at play as to why average click-through rate increased.
“CTRs have been increasing YoY for five years, largely driven by new ad features and SERP changes, including larger ads, more ads above the fold, and ads that blend in more with organic results,” said Elisa Gabbert, Director of Content Marketing at LocaliQ.
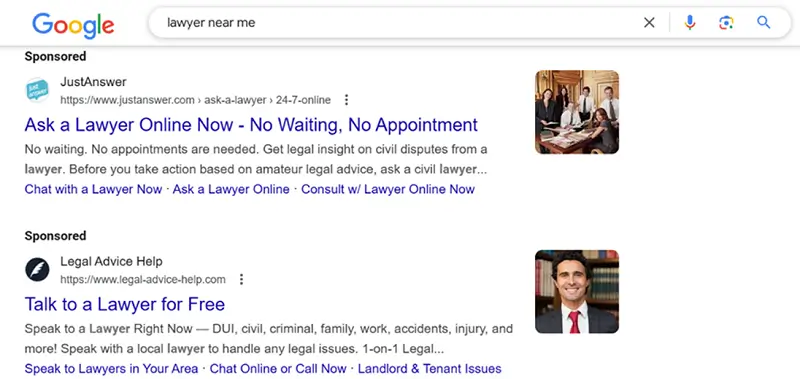
Ads now look more like organic results than ever before, so users may be more likely to click on them. In the example below, aside from the “sponsored” flag at the top of these ads, there is not much that differentiates them from the typical organic result.

This layout has certainly come a long way from the old Google Ads formats from years ago that had the yellow “Ad” flag.
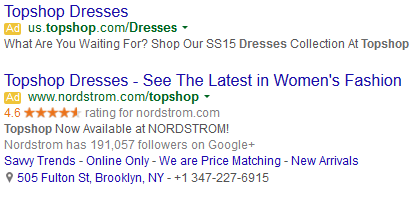
Throwback to when ads looked like this!
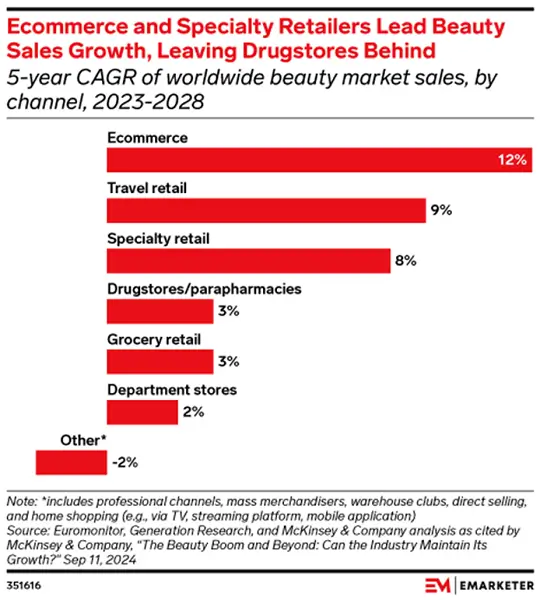
We suspect that Beauty & Personal Care saw the biggest decline in average CTR year over year because competition has significantly increased in that industry. Thanks to the emergence of online shopping platforms like TikTok Shops and Amazon, it’s easier than ever for new beauty brands to pop up.
In fact, social and ecommerce sales drive more than 50% of overall beauty sales globally. Although potential shoppers may not be clicking as frequently on a beauty brand’s search ads, businesses in this industry should run Google Ads that build brand awareness and drive users to their online shops.
How to improve your search ads click-through rate
There are two core problems likely at the root of any low click-through rate: targeting and ad copy or creative.
To start, if you’re not hitting the right audience members at the right time, they’ll be less likely to click on your ad. It’s important to review your keyword lists often to ensure you’re hitting high-intent, transactional terms.
As for creating compelling ads, be sure you’re taking advantage of ad assets, like sitelinks or image assets, to make your ads more clickable and enticing. If you don’t have the bandwidth to refresh your ads often, try leaning into AI tools to help you whip up new lines of ad copy or unique creative assets. Just be sure to double-check any AI-generated ad elements before you set them live. Check out this resource for more ways to improve your click-through rate.
💡Try the new, free AI copy tool from our friends at LocaliQ for instant copy-and-paste headlines and descriptions!
Average cost per click in search ads
Click-through rate and cost per click go hand-in-hand in Google Ads. If you’re getting a high click-through rate and high costs per click, you’ll spend your budget faster. That’s why CPC is so dependent on factors such as your bidding strategy, industry competition, and more.
The average cost per click in Google Ads in 2025 is $5.26.

| Business Category | Average CPC |
| Animals & Pets | $3.97 |
| Apparel / Fashion & Jewelry | $4.31 |
| Arts & Entertainment | $1.60 |
| Attorneys & Legal Services | $8.58 |
| Automotive — For Sale | $2.41 |
| Automotive — Repair, Service & Parts | $3.90 |
| Beauty & Personal Care | $5.70 |
| Business Services | $5.58 |
| Career & Employment | $5.16 |
| Dentists & Dental Services | $7.85 |
| Education & Instruction | $6.23 |
| Finance & Insurance | $3.46 |
| Furniture | $3.86 |
| Health & Fitness | $5.00 |
| Home & Home Improvement | $7.85 |
| Industrial & Commercial | $5.70 |
| Personal Services | $5.81 |
| Physicians & Surgeons | $5.00 |
| Real Estate | $2.53 |
| Restaurants & Food | $2.05 |
| Shopping, Collectibles & Gifts | $3.49 |
| Sports & Recreation | $2.64 |
| Travel | $2.12 |
Industries that saw the lowest average cost per click included Arts & Entertainment ($1.60), Restaurants & Food ($2.05), and Travel ($2.12).
Meanwhile, the industries with the highest average cost per click included Attorneys & Legal Services ($8.58), Dentists & Dental Services and Home & Home Improvement (both at $7.85), and Education & Instruction ($6.23). It’s not surprising to see these industries on the higher end of the CPC spectrum; they typically have high-competition keywords, and clicks can yield higher purchase values for these types of businesses.
However, the economic landscape likely has an impact on industries with high average CPCs as well, like the Home & Home Improvement category.
“One of the most notable trends in the advertising landscape is the rising costs associated with Home & Home Improvement services, which are now closely following the traditionally high costs of attorney and legal services,” said Navah Hopkins, Brand Evangelist at Optmyzr.
Average cost per click: YoY
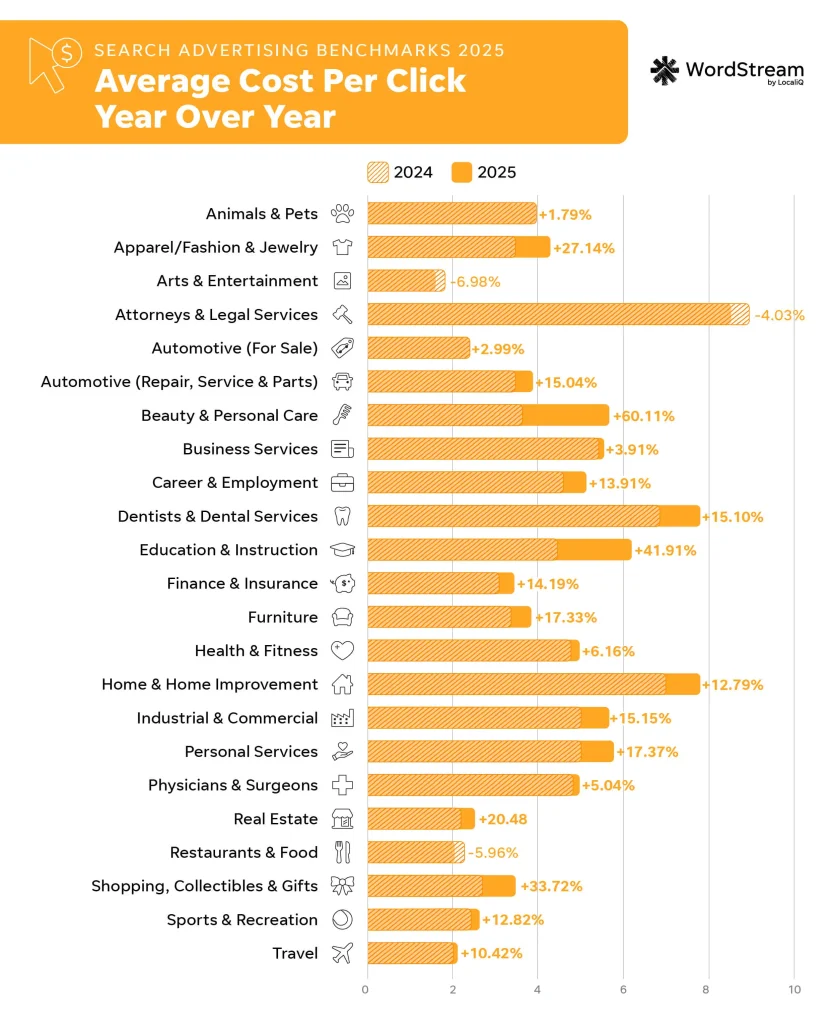
The industries with the biggest decreases in cost per click were Arts & Entertainment—down 6.98%, then Restaurants & Food—down 5.96%, and Attorneys & Legal Services—down 4.03%.
On the other end, Beauty & Personal Care average cost per click was up 60.11%, followed by Education & Instruction up 41.91%, and Shopping, Collectibles, & Gifts up 33.72%.
The overall average cost per click in Google Ads across all industries increased by 12.88%.
Education & Instruction, seeing one of the biggest increases in cost per click year over year, could indicate a general lull in the industry.
For example, many educational institutions—including both higher education and K-12 schools—are bracing for a looming enrollment cliff. It’s projected that the average number of high school graduates per year will decrease by 10.7% by 2037, plus over a third of US adults report having little to no confidence in higher education.
Of course, there will always be opportunities for education-based businesses and organizations to tap into their markets via search ads. However, these trends may indicate that hard-to-come-by clicks will be of higher value and come with higher associated costs.
How to lower cost per click
You always want to keep your Google Ads costs low. The lower your cost per click, the better, since that means you’re spending less overall and can inherently lower your cost per lead.
While we share plenty of ideas to lower your cost per click in Google Ads here, keep in mind factors that may be out of your control, like industry competition. For example, Google Ads recently updated its unfair advantage policy to now allow the same brand to serve multiple ads in different locations on the SERP, which could drive up costs. In this case, it’s best to master campaign basics to ensure your landing pages, keywords, and ads are tightly aligned to increase Quality Score and, in turn, lower your cost per click.
Additionally, your bidding strategy could have an impact on your cost per click. For example, if you choose an automated smart bidding strategy that’s optimizing for conversions over clicks, Google’s machine learning might bid higher for queries more likely to convert—even if they’re more competitive and expensive.
According to Katia Hausman, Vice President of Product at LocaliQ, “The rate of CPC increases varies depending on optimization type, but we’ve seen sharper increases on campaigns with smart bidding, which is likely expected since Google has direct control over these CPCs.”
💸 Want to lower your costs fast? Download our free guide to 6 easy ways to save big in Google Ads now!
Average conversion rate in search ads
Conversion rate is a crucial PPC metric when it comes to gauging your search ad performance, because it proves how well your ads are equating to real sales or leads.
A high conversion rate indicates that your ads are showing to interested potential customers with ad copy and creative that’s compelling enough to hook them in and that your landing page is optimized for the buyer’s journey.
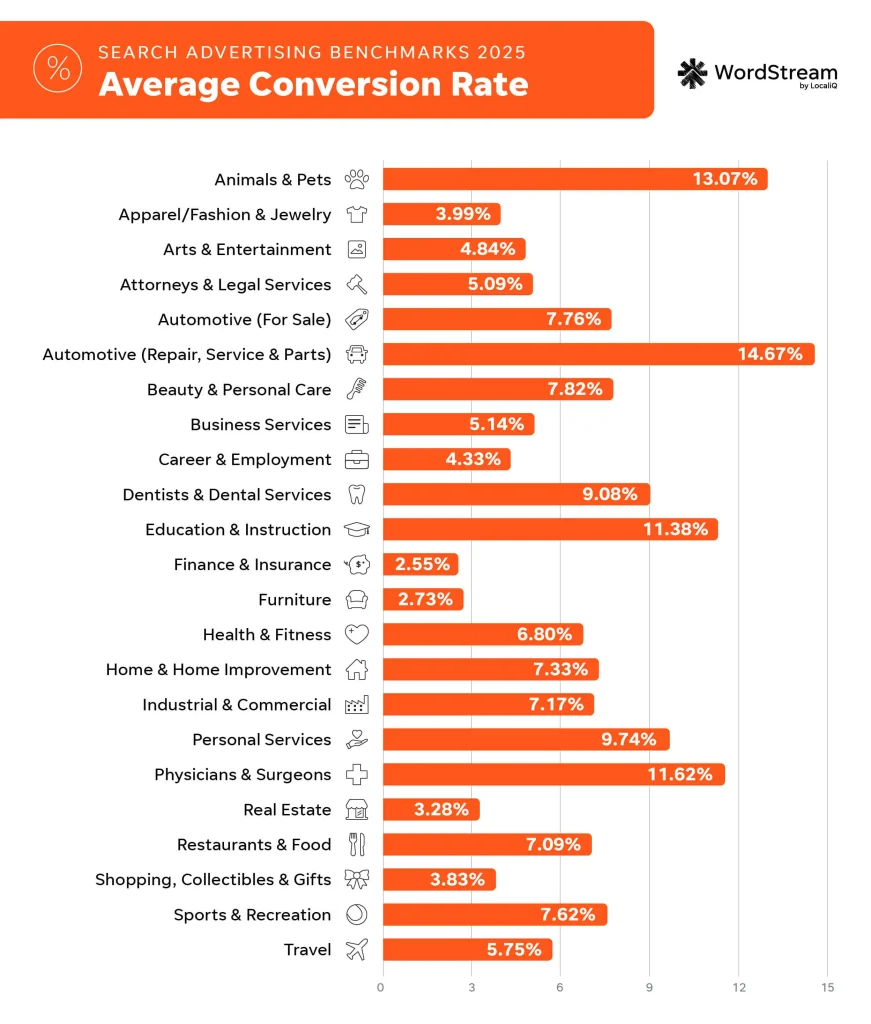
The average conversion rate in Google Ads in 2025 is 7.52%.
| Business Category | Average CVR |
| Animals & Pets | 13.07% |
| Apparel / Fashion & Jewelry | 3.99% |
| Arts & Entertainment | 4.84% |
| Attorneys & Legal Services | 5.09% |
| Automotive — For Sale | 7.76% |
| Automotive — Repair, Service & Parts | 14.67% |
| Beauty & Personal Care | 7.82% |
| Business Services | 5.14% |
| Career & Employment | 4.33% |
| Dentists & Dental Services | 9.08% |
| Education & Instruction | 11.38% |
| Finance & Insurance | 2.55% |
| Furniture | 2.73% |
| Health & Fitness | 6.80% |
| Home & Home Improvement | 7.33% |
| Industrial & Commercial | 7.17% |
| Personal Services | 9.74% |
| Physicians & Surgeons | 11.62% |
| Real Estate | 3.28% |
| Restaurants & Food | 7.09% |
| Shopping, Collectibles & Gifts | 3.83% |
| Sports & Recreation | 7.62% |
| Travel | 5.75% |
The industries with the best average conversion rates were Automotive—Repair, Services, & Parts at 14.67%, Animals & Pets at 13.07%, and Physicians & Surgeons at 11.62%.
In contrast, industries with the lowest average conversion rates were Finance & Insurance at 2.55%, Furniture at 2.73%, and Real Estate at 3.28%.
Average conversion rate: YoY
The industries that saw the biggest increases in conversion rates were Education & Instruction (up 43.87%), Sports & Recreation (up 42.43%), and Apparel, Fashion & Jewelry (up 14.69%).
Meanwhile, the industries that saw the biggest drops in CVR year over year were Career & Employment (down 23.09%), Restaurants & Food (down 18.69%), and Home & Home Improvement (down 14.97%).
Despite rising costs, the average conversion rate increased by 6.84% year over year, which reinforces the effectiveness of search ads in driving leads for businesses. Although this could also be the result of a more stable economy and cooling inflation over the last year, market uncertainty has returned, so we’re curious how conversion rates will change throughout the year.

How to improve conversion rate
It might seem counterintuitive at first, but to address a low conversion rate, you’ll have to first address your CTRs and CPCs. For instance, if you’re getting less clicks at higher costs, it’ll be more difficult to maintain a high conversion rate as your budget stretches to cover what are likely lower-intent clicks. Remember, a click is half the battle when securing a conversion.
“Rising CPCs are one of the only constants in Google Ads, so it’s refreshing to see advertisers focusing on what they can control in response: conversion rates,” said Jyll Saskin Gales, Google Ads Coach.
If you find you want to squeeze more out of your conversion rate and your CTRs and CPCs are already maximized, you may want to consider new conversion actions to test on your landing pages to make it easier for visitors to take action on your site.
“Everything comes down to your landing page offer in combination with your ad. If your focus area was on making your ad and landing page as conversion-friendly as possible, then CVR will improve as well,” said Brett McHale, Founder of Empiric Marketing.
“Landing page optimization, compelling creative, offline conversion tracking—these are some of the tools we have to increase conversion rate and keep ROI in line. 65% of industries saw increases in average conversion rates this year, a promising trend to counteract rising costs,” Jyll said.
Other marketing channels can also help support your Google Ads conversion rate optimization efforts, as your social media accounts might inspire potential customers to search for your business online, and so on.
Be sure to check out this resource for more conversion rate optimization tips.
⚡Get ideas to optimize your campaigns and increase conversion rates fast with a free, instant account report from our Google Ads Grader!
Average cost per lead in search ads
While you want to consider all your available metrics when evaluating your PPC reporting and performance, cost per lead is one that usually gets special attention. It’s the “money metric” for many advertisers because it defines the bang for your buck.
Cost per lead (also referred to as cost per conversion, cost per action, or cost per acquisition) can indicate how effective your campaigns are at delivering marketing ROI, since it calculates how much you’re spending for a conversion on average.
“Ultimately, cost per lead, when used in tandem with lead value tracking, is the most important PPC metric because it directly reflects the value generated from advertising efforts, which is why tactics like call scoring and value-based bidding are so important,” Katia said.
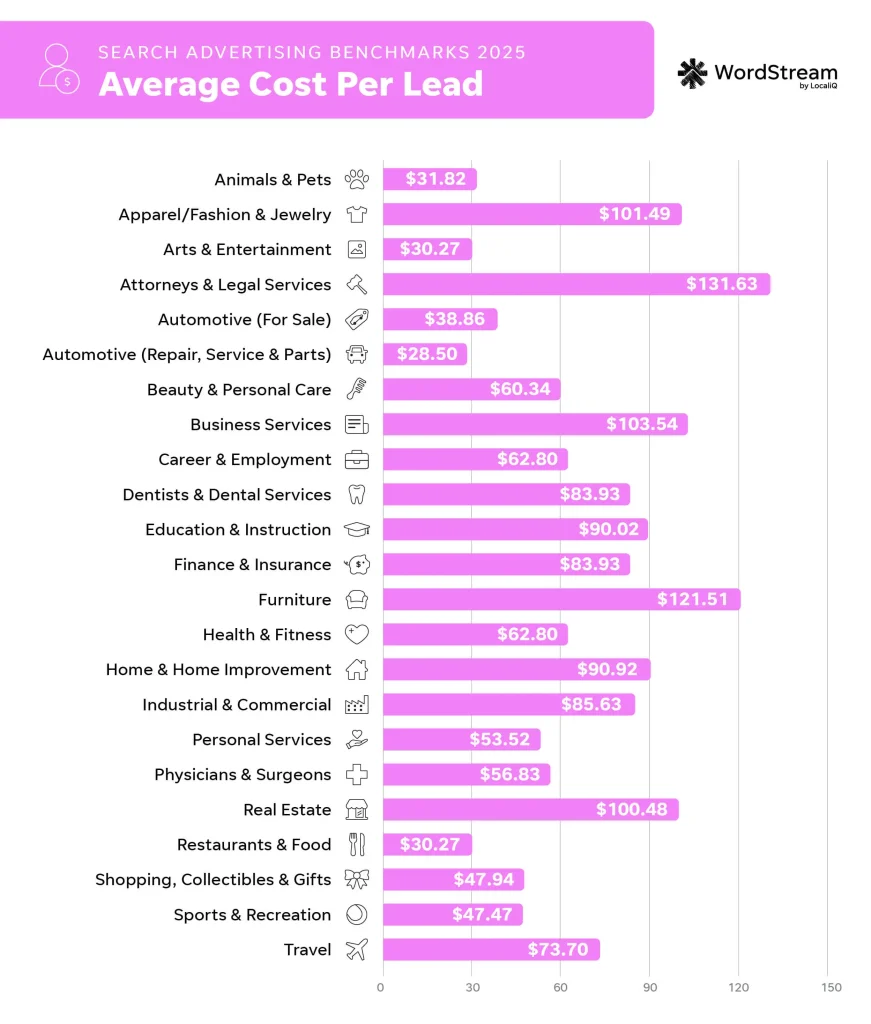
The average cost per lead in Google Ads in 2025 is $70.11.
| Business Category | Average CPL |
| Animals & Pets | $31.82 |
| Apparel / Fashion & Jewelry | $101.49 |
| Arts & Entertainment | $30.27 |
| Attorneys & Legal Services | $131.63 |
| Automotive — For Sale | $38.86 |
| Automotive — Repair, Service & Parts | $28.50 |
| Beauty & Personal Care | $60.34 |
| Business Services | $103.54 |
| Career & Employment | $62.80 |
| Dentists & Dental Services | $83.93 |
| Education & Instruction | $90.02 |
| Finance & Insurance | $83.93 |
| Furniture | $121.51 |
| Health & Fitness | $62.80 |
| Home & Home Improvement | $90.92 |
| Industrial & Commercial | $85.63 |
| Personal Services | $53.52 |
| Physicians & Surgeons | $56.83 |
| Real Estate | $100.48 |
| Restaurants & Food | $30.27 |
| Shopping, Collectibles & Gifts | $47.94 |
| Sports & Recreation | $47.47 |
| Travel | $73.70 |
The industry with the lowest average cost per lead was Automotive — Repair, Service & Parts with an average CPL of $28.50. This industry was followed by Restaurants & Food and Arts & Entertainment, both with a CPL of $30.27, and Animals & Pets with a CPL of $31.82.
The industries with the highest average costs per lead were Attorneys & Legal Services at $131.63, Furniture at $121.51, and Business Services at $103.54. While these CPLs are on the higher end compared to all the industries we looked at, it’s important to keep in mind the value of a lead for these types of businesses. For example, a Business Services lead could equate to a larger, higher value purchase as the lead moves through the B2B sales cycle.
Average cost per lead: YoY
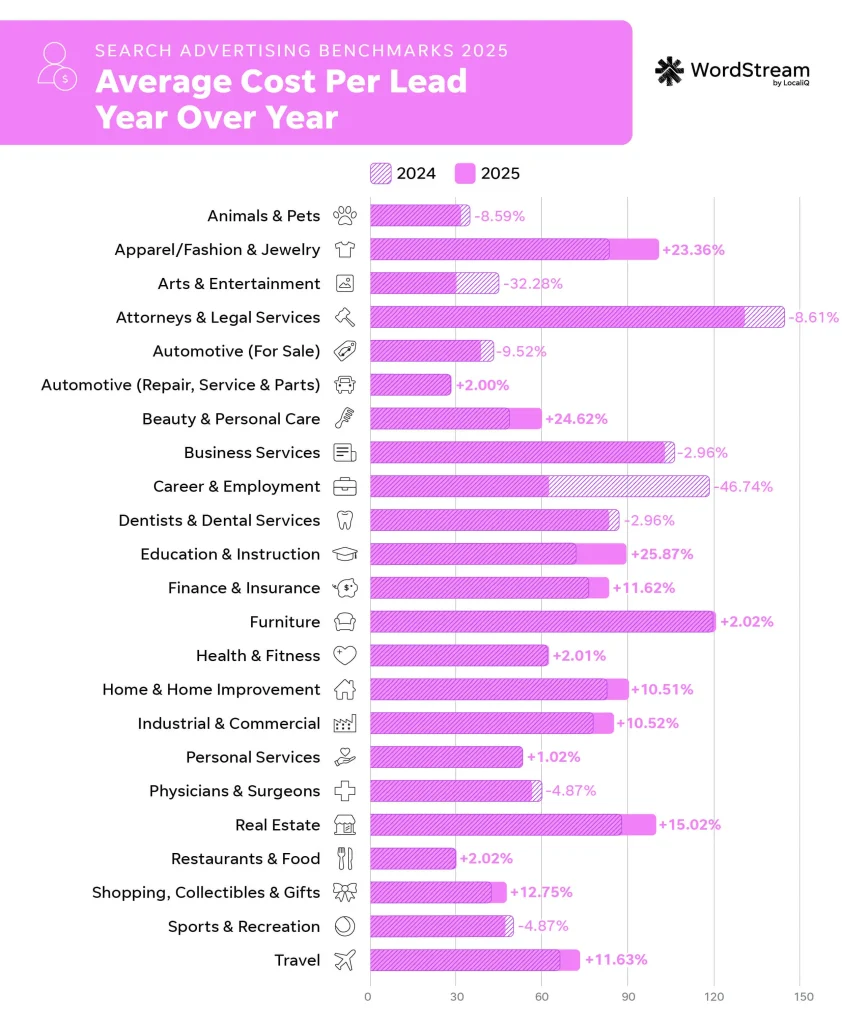
The industries that saw the steepest drops in average cost per lead year over year were Career & Employment (down 46.74%), Arts & Entertainment (down 32.28%), and Animals & Pets (down 8.9%).
On the opposite end, Education & Instruction saw the biggest increase in CPL year over year as its average rose by 25.87%. This industry was followed by Beauty & Personal Care, which increased by 24.62%, along with Apparel, Fashion & Jewelry, which increased by 23.36%.
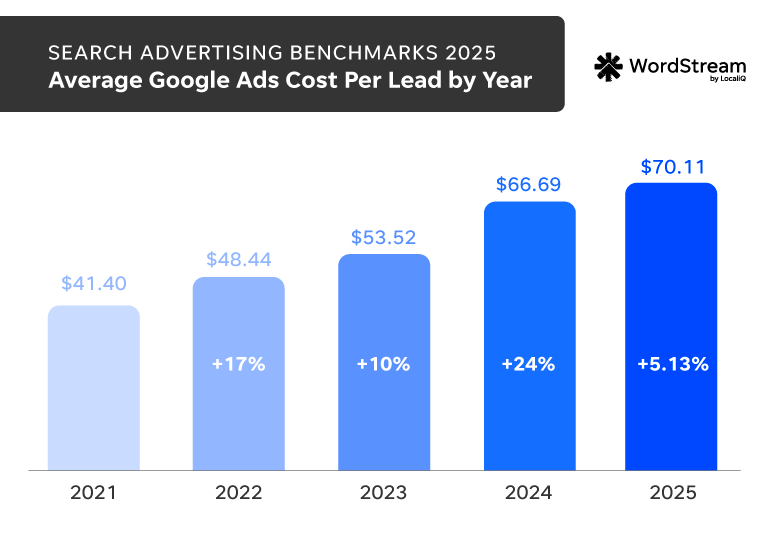
The overall average cost per lead in Google Ads across all industries went from $66.69 in 2024 to $70.11 in 2025, indicating a 5.13% increase. This year-over-year increase is much more mellow compared to the 25% average increase we saw last year when comparing 2024 to 2023. After are large increase in CPL last year, it’s good to see this metric leveling off a bit.
How to lower cost per lead
If you’re feeling like your average cost per lead isn’t up to par with your industry average, there are countless options for how you can work to lower it. Keep in mind, too, that fluctuations and variations in average cost per lead are completely normal. Not only that, but your cost per lead data will be dependent on how you track and assign values to your conversion actions. Plus, you may need to consider your lead quality when evaluating your cost per lead.
“Cost per lead is an essential metric, but measuring lead quality and value is just as important today. Advertisers need to track the real business impact of those leads. Feeding platforms actual conversion value signals, like scored call data, improves CPL over time,” said Alessandro Colarossi, Director of Account Management at SearchKings.
“In industries like Home & Home Improvement, where the average CPL is already $90.92, focusing on better lead quality over sheer quantity is critical,” Alessandro said.
It also may be beneficial to evaluate your other marketing platforms in tandem with your search ads cost per lead to see how you could bring down costs across the board to work towards your business’s bottom line.
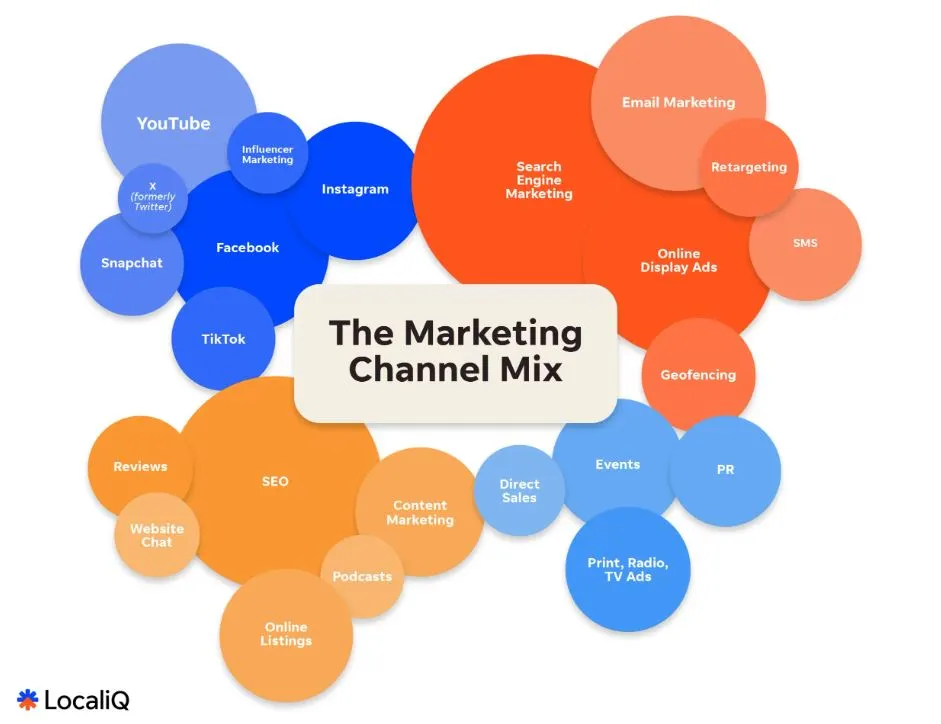
An example of marketing channels that could complement your search ad strategy and help you bring down costs overall.
What these search ad benchmarks mean for your business
Regardless of how your current PPC results align with your industry’s averages, there are always ways you can improve and optimize your campaigns!
“Cost per lead is either increasing at a slower pace or decreasing altogether for many industries, mostly due to improving conversion rates. This suggests ads, keywords, and landing pages are becoming more relevant, leading to a higher percentage of website visitors contacting the business,” Katia said.
To help you make smart PPC strategy decisions, here’s what to know about the key trends and takeaways from these Google Ads benchmarks.
1. Keeping an eye on SERP changes is hugely important
Google has already been looking for additional ways to squeeze money out of the SERP, like reversing a long-held rule keeping businesses from running multiple ads on the same SERP. We expect Google to also introduce more ad options within AI Overviews to further monetize the search results page.
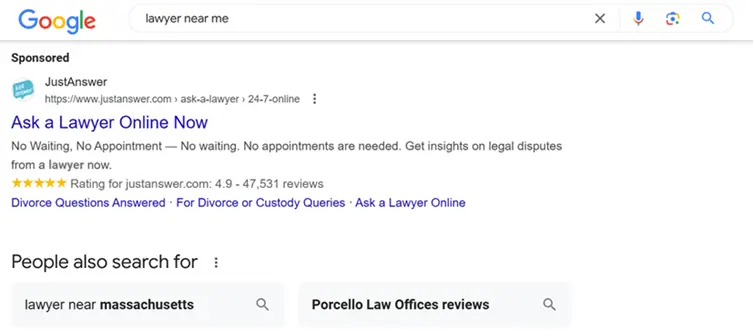
There are ads for JustAnswer in the top ad spot and then again further down the page in this SERP example, proving how Google’s recent updates are changing the ad landscape.
2. Diversifying your search ad strategy is key
As we’ve seen potential ad placements expand and become more streamlined with campaign types like Performance Max and Demand Gen campaigns, it’s more important than ever to take advantage of all the options Google has available to reach your audience.
You might not be able to rely solely on search ad placements and could expand to other strategies like Shopping Ads or Local Services Ads to supplement your search campaigns and improve your overall account health.
More campaign variety could also lead to lower CPCs in general. For example, industries that rely heavily on visuals to showcase their offerings are generally seeing lower costs as they move towards media-rich, feed-based campaign types.
“It is intriguing to observe how inexpensive categories such as Real Estate have become. The affordability of Real Estate is particularly surprising, as one would expect the CPCs in this sector to be more competitive,” Navah said.
“This raises questions about whether the introduction of Performance Max campaigns is contributing to the lower average CPCs, as more Real Estate marketers adopt this feed-based campaign type,” Navah said.
You should also consider all your search ad platform options. For example, you can replicate your Google Ads success on Microsoft Ads for typically a lower cost.
“Diversifying your advertising spend across different platforms can help offset rising costs on any single platform. This allows you to reach different audiences while reallocating budgets to the ad publishers that deliver the best conversions,” Katia said.
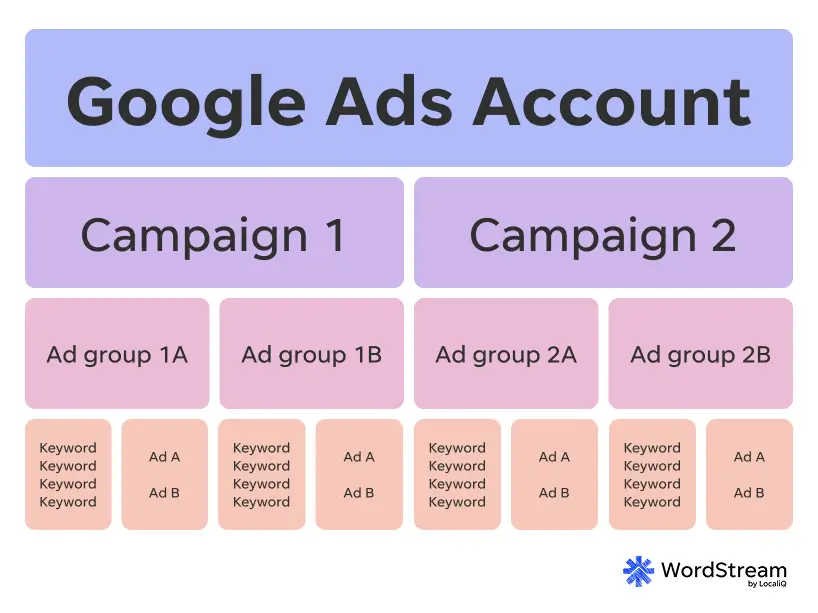
3. Account structure can make or break your experience in the ad auction
How you break out your campaigns and segment your target audiences has a huge impact on performance. It’s important to consider your account structure when evaluating costs, as auctions for certain campaign types or audience segments may be more competitive than others. This means your different campaigns may require variations in keyword lists, budget, bidding strategy, and more.
🗺 Map out your account for success now using our free guide to the perfect Google Ads account structure!
“It is essential to pay close attention to auction prices. If there are significant variations across different regions or business segments—where some areas are costly while others are more affordable—it is crucial to manage these differences effectively,” Navah said.
“Keeping these variations in separate campaigns allows for more efficient budgeting and resource allocation,” she added. “Ultimately, it is vital to align your campaigns with the revenue generated from sales, regardless of whether the transaction is immediate or part of a lead generation process.”
4. Fine-tuned targeting is a must
The right account structure can also help you target more effectively.
“A big tip I have for improving search ad results would be to know your audience and optimize your campaign to that audience. The more tailored your ads can be for the audience most likely to convert, the better,” said Stephanie Scanlan, Vice President of Client Success at LocaliQ.
“Use tools, such as settings by demographics, to make sure your ad spend is going towards people who would use the product or service you’re selling. Add in audiences to help your ads show for people who have engaged with similar businesses or industries recently. Know your audience well and maximize your reach to them,” Stephanie said.
In this instance, your PPC goals can be a guiding light for your campaign structure and targeting strategy.
“Build campaigns that are hyper-focused on the goal that you are trying to achieve. Google Ads (and nearly every other ad platform) is heavily pushing broad ‘AI-enhanced’ targeting. While this can be helpful, you still want to maintain as much control over targeting as possible. Don’t always opt for the easiest campaign setup with Performance Max or other AI features. Instead, test AI-powered capabilities first and use them strategically,” Brett said.
From there, you can create ads that are tightly aligned to your campaign’s audience segments.
“Always focus on creative and messaging. Once targeting is optimized, your best strategy is to heavily focus on where folks are landing from your ads and what is going to draw them there to convert. Conversions start at the ad level and work their way down. Make that process as seamless as possible,” Brett said.
5. Focusing on overall ROI throughout the year should be a priority
While it can be easy to get bogged down with one specific metric, try to think about how these key Google Ads metrics play into your business’s overall bottom line. While it’s important to track individual performance metrics within Google Ads, you should find ways to uncover your search ads ROI as a whole, too.
“At the end of the day, with PPC it is about the ROI. Is your PPC campaign putting money back into your business and helping it grow? For a business owner, it is important to continually optimize your PPC campaigns for what is generating ROI at that moment in time,” Stephanie said.
Your PPC ROI may be subject to seasonality as well. So, be ready to shift your strategy as needed throughout the year to maintain an effective, always-on approach to your campaigns.
“Industries see shifts throughout the year, and what was giving you the best ROI in April won’t necessarily be the same services or products giving you the best ROI in October. Your PPC campaign needs to be adjusted along with this to ensure you’re maximizing your best ROI,” Stephanie said.
6. Don’t be surprised if industry competition continues to increase
With the current state of search advertising, it’s inevitable that competition is only going to increase for most industries. To combat this and stay ahead, lean into first-party data and value-based campaign tracking and bidding.
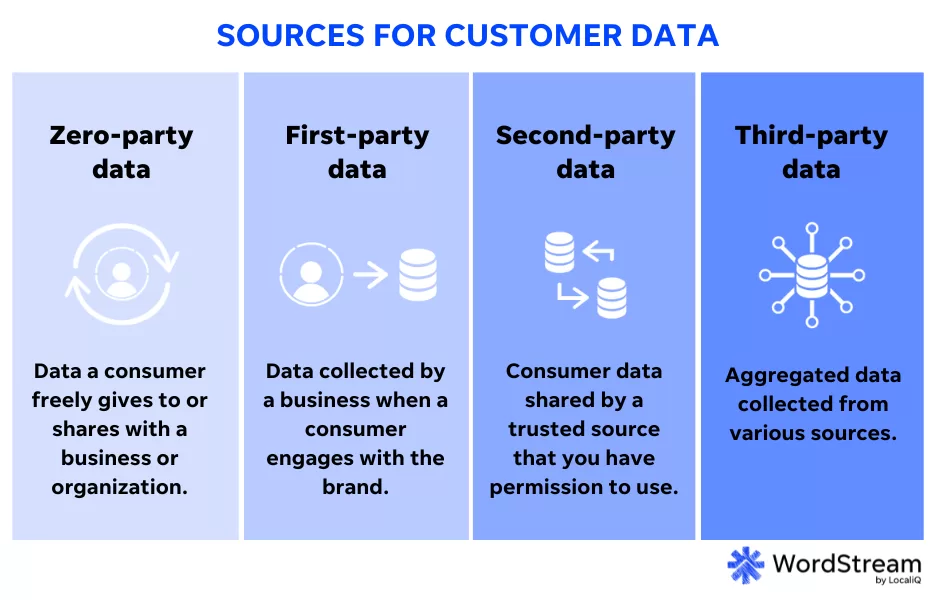
“Advertisers seeing the strongest long-term results despite rising competition are the ones strengthening their first-party data foundations. For instance, using customer match for prospecting, GA4 audiences for smarter targeting, and securing conversion durability through enhanced conversions and GA4 user-provided data,” Alessandro said.
“The widening gap between CPC and CPL across industries really stands out to me. While some categories like Automotive—Repair, Service & Parts show a manageable cost per click of $3.90, the cost per lead still stretches to $28.50,” Alessandro said.
“On the higher end, Attorneys & Legal Services has a CPC of $8.58 but a much higher CPL of $131.63. This shows that even when clicks are reasonably priced, competition for meaningful conversions can drive lead costs significantly higher. It highlights the growing need for advertisers to track and value their conversions carefully as acquisition costs continue to rise.”
The value a search ad lead brings to your business can make dealing with high costs and competition well worth it.
“The ultimate measure of success is the value of the leads generated. It’s acceptable for CPC to rise if CPL is falling and conversion rates are improving. Therefore, it’s important to invest in tools that allow you to understand the true value of your leads to get a complete picture of performance,” Katia said.
7. Auditing your PPC accounts regularly is crucial
As the overall averages for CTR, CPC, CVR, and CPL have fluctuated in recent years, you’ll want to stay ahead of any potential changes to your account performance. Auditing your PPC accounts regularly can help you understand how your campaigns are performing against benchmarks in your industry.
Try finding an easy-to-follow audit structure that works best for you and your team. For example, many advertisers use the SWOT analysis exercise (which looks at their account’s strengths, weaknesses, opportunities, and threats) to track, benchmark, and optimize their performance.
Or, you could try following a checklist, like the example below, to be sure you’re covering all your performance tracking bases.

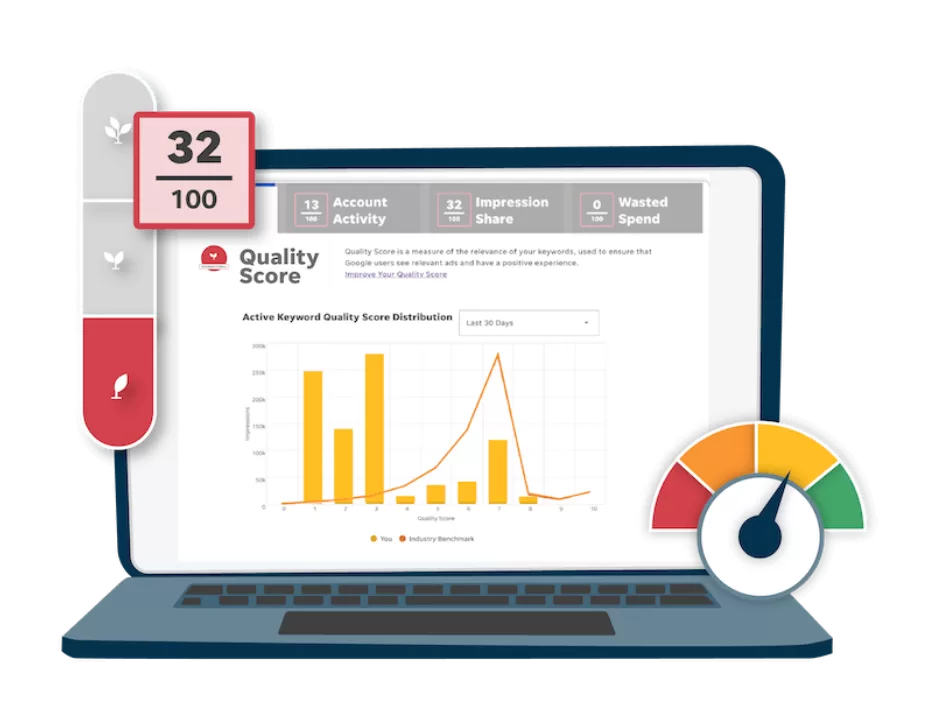
👀 Want a true read of your Google Ads campaign performance? Try our free Google Ads Grader for an instant account report!
Google Ads benchmarks 2025: How to take action in your account now
Remember, no two Google Ads accounts are exactly the same. While these benchmarks can be a guiding light when measuring PPC performance, what might work for one advertiser may not work for another. So, use this data as a reference point for which direction to take your account optimization strategy according to your business’s unique needs.
Search ads campaigns are flexible, and you can use data like the averages in this report to pivot your strategy when it matters most. The sooner you start tracking your performance alongside industry benchmarks, the better. For more help making the most of your search ads, see how our solutions can maximize your campaign strategy!
About the data
This report is based on a sample of 16,446 US-based search advertising campaigns running between April 1, 2024, and March 31, 2025. Each category includes at minimum 64 unique active campaigns. “Averages” are technically median figures to account for outliers. All currency values are posted in USD.

Meet The Author
Susie Marino
Susie is the Senior Content Marketing Specialist for WordStream and LocaliQ, where she uses her experience as a PPC consultant to share tips, tactics, and best practices in the ever-evolving marketing and advertising space. Susie’s work has been featured in publications such as Search Engine Land, MediaPost, Social Media Today, and others. Outside of work, Susie loves to get outside for some snowboarding or (once the cold weather melts away) hiking!
Recommended for you