If you’re in marketing, advertising, or doing anything related to PPC, odds are you’re not a fan of math. Crazy, I know, with all the data we have to crunch. But, with so many variables, even the savviest numbers wiz can find their head spinning as soon as they log into the platform.

Luckily, a lot of the hard work is done for us automatically through the metrics displayed in our reports. All we need to do is, well, know what they actually mean.
That’s why I’ve put together this complete guide to PPC metrics. Which includes:
- Easy-to-understand definitions for 28 PPC metrics.
- Specific tips on how to improve each one.
- The context you need to determine which metrics are most important to you.
Treat this post as your one-stop shop to tackle PPC data like a pro by knowing every and any metric you’ll ever need.
PPC metrics table of contents
Click to jump to each metric in this post.
Universal PPC metrics
Like with anything in PPC advertising, not all metrics created equal. There are some metrics that hold enough weight to be acknowledged across any campaign type. Check out these “bread and butter” PPC metrics:
1. Impressions
At the bare minimum, impressions is the perfect starting point when it comes to understanding PPC metrics. An impression is counted whenever someone views your ad, regardless of whether they click on it.
Let’s say your ad shows in a lower position on the SERP. Unless the searcher scrolls down to physically see your ad, you won’t get an impression.
Impressions are usually free unless you choose to pay by impressions versus clicks. You can also have multiple impressions from the same person.
How important are impressions?
Impressions can be telling in any PPC situation. For example, if you have a high number of impressions but a low number of clicks or conversions, this tells you people are not inclined to click on your ads, and that you may need to improve your ad copy, targeting, or something else.
The highlight of impressions is that, at minimum, you’re getting eyeballs on your ad and increasing brand awareness.
How to increase impressions
If you’re looking to increase impressions, here’s what you can do:
- Increase your budget: The more budget you have to play with, the more you’ll be able to bid in Google Ads auctions. If your budget is small, your clicks will eat it up too quickly in a day and you won’t be able to continue bidding (and showing) for more impressions. Adding budget when you can will allow you to balance out your bids day by day for a healthy impression share.
- Use broad match keywords: For search campaigns, try loosening your keyword match types to phrase match (or even broad match) as another go-to for more impressions. Since looser match types like broad or phrase have flexibility to match up to more searches, you’ll be able to show to more people on the SERP.
- Broaden your targeting: This applies to all campaign types, but broadening your location, audience, or other forms of targeting is a given when it comes to getting more impressions.

2. Click-through rate (CTR)
Click-through rate is clicks divided by impressions. Don’t worry, the platform does the math for you! It’s the ratio of how many clicks you pulled in in comparison to how many impressions you showed for. It’s displayed as a percentage, and can vary across accounts as well as verticals.
CTR tells you how well your ad copy is resonating with your audience. Similar to our example above, a high number of impressions but low rate of clicks tells us that people aren’t taking action on the ads you’re presenting to them.
How important is click-through rate?
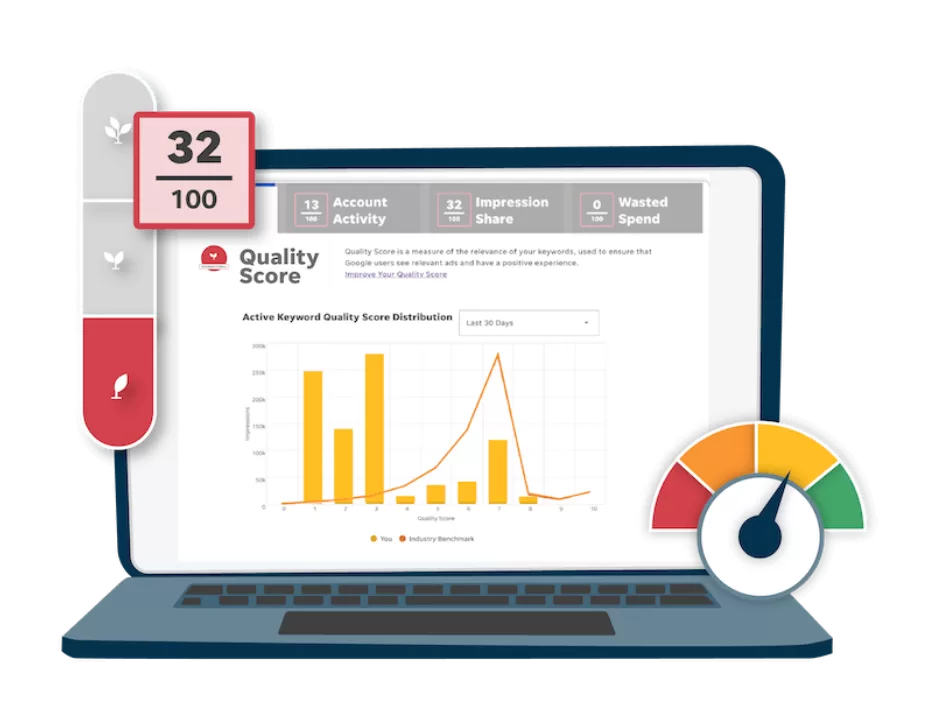
Not only does click-through rate clue us in on how our ad copy and targeting is doing, but it is also one of the three contributing factors when it comes time to assign your Quality Score.
However, click-through rate often gets a bad reputation because it doesn’t always equate to actual money-making conversions. Think of it this way: if you had a high conversion rate but a low click-through rate, you’d want to improve that click-through rate to maximize your conversion opportunities!
What’s a good click-through rate?
This depends on a number of factors. For example, the average CTR for the hobbies and leisure industry on Google Search is 7.45%, 0.38% on Google Display, and 0.92% on Facebook. And other industries have much lower or higher average CTRs.
Use our search advertising benchmarks to identify a good click-through rate for your industry.
How to improve click-through rate
We have many posts on how to improve your CTR, but here are some brief tips.
- Adjust your bids: If you’re on manual bidding, you could try raising your bid to rank higher. Showing up higher on the SERP (or more frequently across other ad types’ networks) will catch viewers’ attention quicker and you’ll be more likely to snag their clicks. If you’re not using manual bidding, try maximize clicks as your automatic strategy since it has the end goal of driving up your CTR. More help with bidding adjustments here.
- Schedule your ads: Ad scheduling is a smart workaround to a higher CTR because it limits what times of the day you show. Inherently, your impressions are lowered. Plus, you’re only serving your ad during times that you bring in the most clicks. Learn how to set up ad scheduling in Google, Facebook, and Microsoft here.
- Improve your ad copy: Enticing ad copy will increase your CTR because people will be more interested in clicking. Try A/B testing your headlines, descriptions, or images (if applicable) to find which type of ad brings in the most clicks for a maximized CTR. Find out what ad copy mistakes to avoid here.
- Use ad extensions: Ad extensions are other additions to your regular ad that allow users to have more to click on. Sitelinks, call extensions, or image extensions are all clickable material aside from your ad copy that can pull in more clicks—boosting your CTR in a jiffy! See our list of nine CTR-boosting ad extensions here.
3. Conversion rate (CVR)
Similar to click-through rate, conversion rate is looking at how often you pull in a conversion in relation to your clicks. This metric takes click-through rate a step further by analyzing the ratio of clicks to conversions, and displaying it in a percentage format.
Conversion rate often holds slightly more weight than click-through rate because it tells you how likely someone is to complete an action once they click to your landing page.
How important is conversion rate?
VERY. This metric is the cornerstone to any ROI-driven advertising strategy. If you don’t have a healthy conversion rate, you know you’re paying for clicks that aren’t converting.
Conversion rates can also tell us a lot about the people who are clicking on our ads and viewing our landing pages.
If your conversion rate is low, you may want to ask yourself one of the following questions:
- Is my ad copy misleading or being shown to the wrong type of viewer?
- Are the actions on my landing page clear and accessible?
Conversion rates let us know whether the people clicking on our ads are at the ready to convert, or confused or hesitant once they arrive.
What’s a good conversion rate?
A good conversion rate may be higher than you think! Like anything PPC-related, however, there’s unfortunately no cookie-cutter answer. Check out our most recent data on conversion rate averages for your industry.
How to improve conversion rate
We have tons of tips on improving conversion rate, but here is a brief rundown:
- Include CTAs in ad copy: Whether it’s “schedule an appointment,” “download our guide,” or “sign up now,” anything that lets your viewer know you’re looking for them to complete an action will do. This makes your landing page’s intentions crystal clear. That way, people who click will be ready to convert upon arrival. Check out 11 awesome call to action examples here.
- Improve your landing page
Getting your viewers to click on your ad is only half the battle when it comes to conversion rates. You have to have your action front-and-center on your landing page to help push forward with conversions. You’ll also want to make sure your landing page is mobile-friendly and has concise copy. - Change your bidding strategy: Bidding can sometimes make all the difference in your conversion rates. If you’re struggling with a low conversion rate, try the Max Conversion automatic bid strategy that will optimize to bring you in the most conversions possible. Learn about automated and Smart Bidding here.
- Track more conversions: One sneaky workaround to change your conversion rate numbers is to change what you’re actually tracking. For example, you may only be counting purchases, but there could be other meaningful actions on your site that prove to be valuable in the customer journey. The more actions you have to track, the more likely you’ll have a higher conversion rate. Conversion tracking tips here.

Check conversion rate averages for your industry here.
4. Cost (spend)
Cost is the total spend on any asset you’re analyzing with your account. It’s synonymous with spend. It is calculated by adding up the total cost of each click (or impression—depending on your bidding), and it’s displayed in the form of your account’s selected currency.
How to lower spend:
- Refine your targeting: When you’re more selective of when, where, and to whom your ads show to, you’ll be saving on costs. Think of this as budgeting or managing your finances. You’re looking for places to make cuts. For example, this might mean turning off your ads on certain days or showing to a more specific set of locations.
- Use the search terms report to find negatives/exclusions: You may have unwanted costs hiding right under your nose in the search terms report! This is a great place to go when you want to cut down on spend—especially since the search terms report was just updated to include more search queries. Adding negative keywords from your search terms report will help you avoid spending on clicks that aren’t worth it.
- Identify the culprit with a change history report: In order to save on cost, you need to search all corners of your account for sources of wasted spend. To start your account audit, go to change history. In there, you can change your date range view to see when your cost started to go up. Check to see what changes were done around that time to cause that spike. Sometimes, it’s just a small asset within the grand scheme of your account. One pricey keyword, audience, ad group, or any other portion of your campaign, is oftentimes all that needs to be paused to save your budget.

5. Cost per click (CPC)
Cost per click is of course the price of each click you bring in. It’s displayed as a monetary average across all the clicks coming from a specific keyword, ad, ad group, campaign, or any other asset you may be analyzing.
How to lower your cost per click
- Improve Quality Score
The higher your Quality Score, the less Google will charge you per click. This is because it wants to show the most relevant results to its audience, so it’s willing to sacrifice making less off a click to uphold its ad standards. If you improve your Quality Score, you’ll find you can bid less aggressively to bring your average CPC down over time. Understand how you can achieve a good Quality Score here. - Adjust bidding: Speaking of bidding, your strategy could be the culprit behind your high CPC. Certain automated strategies bid more aggressively depending on the goal they’re reaching for. For example, Max Conversions will bid whatever it needs to bid to bring you in as many conversions as possible—overlooking CPC. Or, you may want to lower your individual bids on Manual, your bid cap on Max Clicks, or your targets for ROAS or CPA. These all affect your bid level, and inherently, your average CPC results. Know what bidding strategy will work best with your CPC here.
- Pause other assets in your account: Let’s say you have an ad targeting a competitive location, audience, keyword, other component. This competition will drive up your CPC since you’ll have to bid more to keep up.You need to lower your CPC, but you can’t bear to part with that targeting because the conversions on that ad are high value. Instead of pausing that ad, you could instead pause other, lower-value ads in your account. Even if they don’t have super high CPCs, pausing them will still lower your overall CPC so you can afford the high CPC campaign that truly matters. Learn what to look for to lower the CPC in your own account.

Check out the full Facebook ads benchmarks report here.
7. Cost per acquisition (CPA)
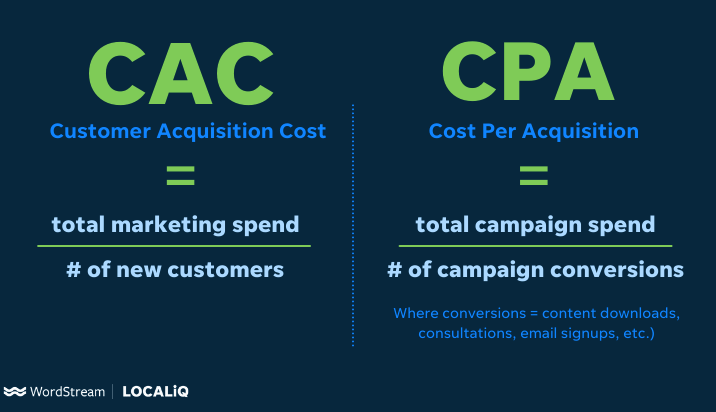
Cost per acquisition can also be known as cost per action, cost per lead, or cost per conversion (I always joke that CPC was already taken, so they went with CPA). It’s basically the same idea as cost per click, but with conversions. This metric takes your total number of conversions in relation to your total spend.
The best part about conversion-related metrics is that conversion actions are extremely customizable. Usually, when people think of a conversion they immediately equate it to a purchase, a phone call, or a lead form-fill. However, what you choose to track as conversions is totally up to you and your business needs.
For example, while a page view, chat messages, or a video play may not directly equate to money made on your end, counting those types of indirect actions as conversions may make sense for your business’s goals. Remember, though, whatever you decide to track as conversions will impact metrics like CPA.
How important is cost per acquisition?
To most accounts, it’s usually considered one of, if not the most, important metric. This metric tells us the “bang for our buck.”
If you’re an ecommerce account, though, it’s more likely you’ll be concerned about ROAS over CPA. ROAS is the revenue tracking sister metric to CPA—which we’ll get into later in the post!
What’s a good cost per acquisition?
There isn’t really any clear answer to this or average benchmark, since CPA measures cost per conversion, where conversion can mean anything you want it to
How to lower cost per acquisition
- Identify areas with highest CPA first: Like we mentioned with other metrics, you need to look at your account from a bird’s eye view. When my clients struggle with CPA, the first place we go is either keywords for search or audience and topic targeting for display.Usually you can pinpoint a high CPA from one specific place, like a keyword. From there, you can brainstorm tweaks you can make to either lower the cost or boost the conversions coming from that component.
- Lower your budget: A lower budget equates to less spend. Remember, there are two factors that go into CPA: spend and conversions. Raising conversions will be costlier and take more time. Meanwhile, saving on budget will lower your costs immediately which can help to lower your CPA for the time being.
- Set or adjust your tCPA: If you’re worried about your current CPA, I’m betting you’re already building out your PPC strategy in a CPA-oriented way. If you have a target CPA set up on your current bid strategy (whether that be legacy tCPA or Max Conversions), try adjusting your target to be a realistic goal.Your CPA may be high due to automated bidding confusion. If you don’t have enough data in your campaign, or the right target set, Google is probably struggling to bid correctly for an optimal CPA. Get more tips on how to lower CPA here.
Get CPA (and lots more!) benchmarks for Google Ads here.
Search-specific PPC metrics
While some metrics are universal, there are a few that are applicable to specific campaign types more than others. Let’s start with Search-specific metrics.
8. Impression share
This, and the next two, are personally my favorite PPC metrics. Weird, I know. In my experience, advertisers get hung up on the rigid metrics like CPA or conversions.
However, impression share (and impression rates—which are coming next) can tell you a lot about your PPC performance in comparison to the general SERP or GDN space.
Impression share essentially answers the question of “out of all the times your ads could be showing, how often are they actually showing up?” After all, getting your ad in front of people is the first step to success.
It’s a platform-specific metric that looks at your total impressions compared to the total eligible searches (or views on GDN) you could have shown for. It’s displayed as a percentage and can vary by name depending on platform or campaign type.
How important is impression share?
Impression share can tell you if you’re missing out on opportunities that could help grow your business. Impression share carries even more weight if one of your PPC goals is to increase brand awareness.
How to improve impression share
- Raise your bids: The higher you bid, the more likely you’ll be to win auctions and be allowed a chance to gain an impression. Plus, your bids work hand-in-hand with your Quality Score to determine your rank. When you rank higher, the more likely you’ll be able to achieve that impression once you make it on the SERP.Again, if you’re not using a manual strategy, adjust your bid limit or targets to be more aggressive. Check out our bid management guide here.
- Adjust your keywords: Most of the time, people think looking at their Quality Score is the first place to go when looking to boost their impression share. However, the keywords and match types you choose can make all the difference on how you perform on the SERP.A less restrictive match type can make it tougher to achieve a higher impression share. The text and intent of your keyword can also impact which types of searches you match up to—especially since Google just updated how it analyzes matching behavior.. Get more details on keywords (and keyword intent) here
- Go after the competition: Be sure to regularly check the Auction Insights section of Google ads to see who you’re sharing the SERP with. They may be bumping you down by outbidding you. While Auction Insights isn’t available for Display, the same logic applies. What can you learn from their ad copy or possibly higher bids that you can apply to your own account? The answer to that question will help you brainstorm ways to increase your impression share. Learn more about Auction Insights here.

Learn how to get your piece of the impression share pie here.
9. Top and absolute top impression rate
Top impression rate and absolute top impression rate are search ad metrics. Both are built off of your impression share and displayed as percentages, and the practices to improve them are the same as impression share. However, their impact on your competitive insights can be even more valuable.
- Top impression rate answers the question of “out of all the times your ads do show, how often do they show in the top pack of ad results (as opposed to on the bottom of the SERP)?
- Absolute top impression rate answers the question of “out of all the times your ads do show, how often are they the very first ad on the page?” This means your ad is the first thing the searcher sees, which is ideal.
Of course, a high rate for either of these metrics can be tough to achieve. I recommend shooting for your top impression rate to hit about 60-80%, and your absolute top rate to be about 20-30%. Your unique needs may change that, though. For example, the more competition you have, the harder it will be to get a high impression share or impression rate.

10-11. Search impression share lost
Okay, so impression share and impression rates tell us the story of when our ads show up on the SERP. But what happens when they don’t? There are two reasons behind why you may be missing out on impressions: either your rank is too low (search impression share lost to rank) or your budget is too low (search impression share lost to budget).
It’s easier and quicker to tackle the latter. You can of course raise your campaign budget, but if that’s not feasible, adjust your targeting to make your budget stretch further.
For the former, you could reevaluate your bidding first as a quick fix. Your max CPC bid is factored in when calculating your rank in any auction. For a longer-term fix, identify any pain points within your Quality Score that you can work to improve on.
For example, you may need to rearrange your landing page or refresh your ad copy.
Conversion tracking PPC metrics
While you should set up conversion tracking for all your campaigns, I will say that these metrics are typically most applicable to Shopping and ecommerce campaigns.
12. Conversion value
Conversion value (conv. value) looks at the sum of values for each of your conversions is the sum of conversion values for your conversions.
Think of this as your quality over quantity metric. We know that a $1000 lead is worth more than a $5 lead. Conversion value helps you understand the total monetary value of your conversions.
That way, if your conversion numbers are low but the conversion value is high, you’re still doing alright! Of course, this metric is only useful if you assigned a value to each of your conversion actions when setting up tracking.
To maximize your conversion value, you may want to start outside of your account. Look at your landing page and evaluate the path your customers take. See if there are steps you can add in or take away to lead them to a more profitable conversion action.

13. Conversion value/cost
This metric calculates your return on investment. It takes your conversion value divided by the total cost of all your interactions. This metric looks at the actions within your customer’s journey holistically to understand how your spend relates to how many steps they took to reach a certain valuable action. A lower conversion value/cost number means you’re getting more out of your ads for less money.
14. Conversion value/click
Conversion value over click divides the total value of your conversions by the total number of clicks (or interactions) your ad gets. Google includes interaction in the definition of this one (even though clicks is in the name) because people can click on or engage with portions of your ad without arriving to your landing page. This metric is helpful when understanding the customer journey and your audience’s behavior. However, it’s not as telling in terms of performance since it’s only looking at the value of conversions and interactions—not actual clicks and conversions.
15. Value/conversion
Not to be confused with conversion value, value over conversion provides an average of how much your conversions are worth. Whereas, conversion value, looks at the total value for total conversions. This metric is an easy, quick gauge of, on average, how much an individual conversion is worth.
16. All conversions
All conversions deserved an honorable mention in this section since it often gets confused with the conversions column. To clarify, all conversions shows every action you may be tracking, even if you opted for them to not be included in your standard conversions column.
For example, if you have a two-step form, you may only count the second step as a true conversion. However, you’ll be able to see the number of completions of the first step under all conversions.
Display & video ad metrics
Search isn’t the only campaign type to get its own metric category. Here are some display-specific metrics to get familiar with.
17-18. Display lost impression share
Display lost impression share (rank) and Display lost impression share (budget)
The basics of these two metrics are the same as they are on search. They tell you what percentage of your missed display or video ad impressions are due to a lack of rank or budget.
While raising budget isn’t always feasible, the nice thing about display ads is they have more targeting variables available than on search, making it easier to improve your rank.
To improve your lost display impression share, try adjusting to a less competitive audience or changing your ad creative. Audience targeting tips here.
19. Relative CTR
If you’re in a highly competitive space, this metric is for you. Your relative CTR tells you display or video ad’s CTR in relation to the industry averages.
20. Viewable impressions
Your viewable impressions metric tells you the number of times your display or video ad was considered “viewable” which means more than 50% of it was seen for more than one second. This helps you understand if your ad was actually looked at.
21. Video played to: 25%, 50%, 75%, 100%
You can probably guess what this metric tells you. Sadly, not every viewer will watch your video ad the whole way through. Luckily, the four “video played to X” metrics tell you how many of your video views were only for a certain length of time. Use this to optimize your video ad content from start to finish!
Learn how to create compelling video ads here.
22. Average CPM
For high-volume video campaigns, average CPM is a helpful metric because it breaks down our total spend by chunks of impressions. 1000 impressions to be exact. Confusing, I know. The abbreviation doesn’t translate well, but CPM stands for cost per 1000 impressions. This metric is commonly leveraged when using CPM bidding.
23. Average CPV
Cost per view is a simple yet supportive metric when it comes to understanding the bang for your buck on display and video campaigns. It averages out about how much each view is worth to you, and you can adjust accordingly if that number seems oddly high.
Since you’re pulling in so many views on display and video, though, it’s usually a pretty low number. If you want to lower it even further, you can try Cost Per View bidding or alternatively, tighten your targeting. That way, when you get a pricey view it will be that much more worth it.
24. View-through conversions
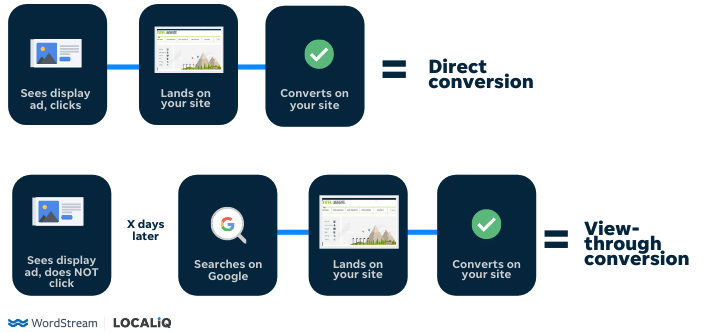
As display and video campaigns are becoming more prominent, so too has this metric. That’s because it finally answers the age-old question of: “If my display campaign has a low CTR and CVR, what is it doing for me?”
View-through conversions tell us how many conversions in your account are from someone who saw, but did not click, on your display or video ad within the last 30 days. This proves the efficacy of your display and video campaigns in growing that brand awareness and triggering a conversion via another route. View-through conversions can tell you if your display or video ads are the primary catalysts to spark a conversion later on.
25. ROAS
Return on ad spend is a major metric for Shopping campaigns, but other campaign types can find this data helpful as well. Similar to conversion value, ROAS tracks the overall revenue your ads are bringing in. It then takes that revenue number and puts it up against your spend.
Shown as a ratio or a percentage, a healthy ROAS can vary from account to account. However, the usual starting point for an ideal ROAS is most commonly about 250-350%.
ROAS can be finicky. To start improving, definitely set a target ROAS on your campaign-level bid strategy. Another option, if you don’t want to fuss over it, is to try Smart Shopping campaigns. And definitely check out my post on How to Improve Google Shopping ROAS with Priority Bidding.
Miscellaneous PPC metrics
26. Invalid clicks
Did you know Google watches out for clicks that could be spam, fake, or from bots? That is the entire point of the invalid clicks column within the platform! This is how many out of your total clicks Google has deemed questionable.
This is helpful if you think you’re being targeted by a competitor or any other sort of click fraud. Google has a complaint form you can use for situations like this so that they can step in and stop any inappropriate activity.
27. Engagements
Engagements are any actions associated with an ad. If someone views your ad, then clicks, those are both considered engagements. The more add-ons you have, like extensions, the higher your engagement rate will be.
28. Interactions
Interactions are the main action associated with an ad. This may be a view, a click, or any other meaningful action done on the ad. This metric is usually more commonly viewed on Display, Video, or Shopping campaigns, since on search this would basically be a click.
Did I miss any metrics? Let me know in the comments. And try out these PPC tools to help you get better results.

