Back in 2017, when Facebook was the new emerging ad platform for SMBs, we released our first Facebook Ad Benchmarks using our client data at the time. That was an exciting time, but thankfully things have changed in the past two years—since 2017, over 1 million new advertisers have joined Facebook, we’ve released our free Facebook Ads Grader, and we’ve watched ad performance on the network change and evolve in many ways.
That’s why we figured we were due to update these stats with new data for 2019! In this post, we dug into new data and collected the performance across thousands of accounts advertising on Facebook to bring your 2019 Facebook Ad Benchmarks, including:
- Average click-through rate (CTR) on Facebook by industry
- Average cost per click (CPC) on Facebook by industry
- Average conversion rate (CVR) on Facebook by industry
- Average cost per action (CPA) on Facebook by industry
You’ll find averages across these Facebook metrics for 13 industries: Beauty & Fitness, Business & Industrial, Finance, Food & Drink, Hobbies & Leisure, Home & Garden, Internet & Telecom, Jobs & Education, News, People & Society, Pets & Animals, Real Estate, and Science.
🚨 Get updated Facebook advertising benchmarks for 2025 here!
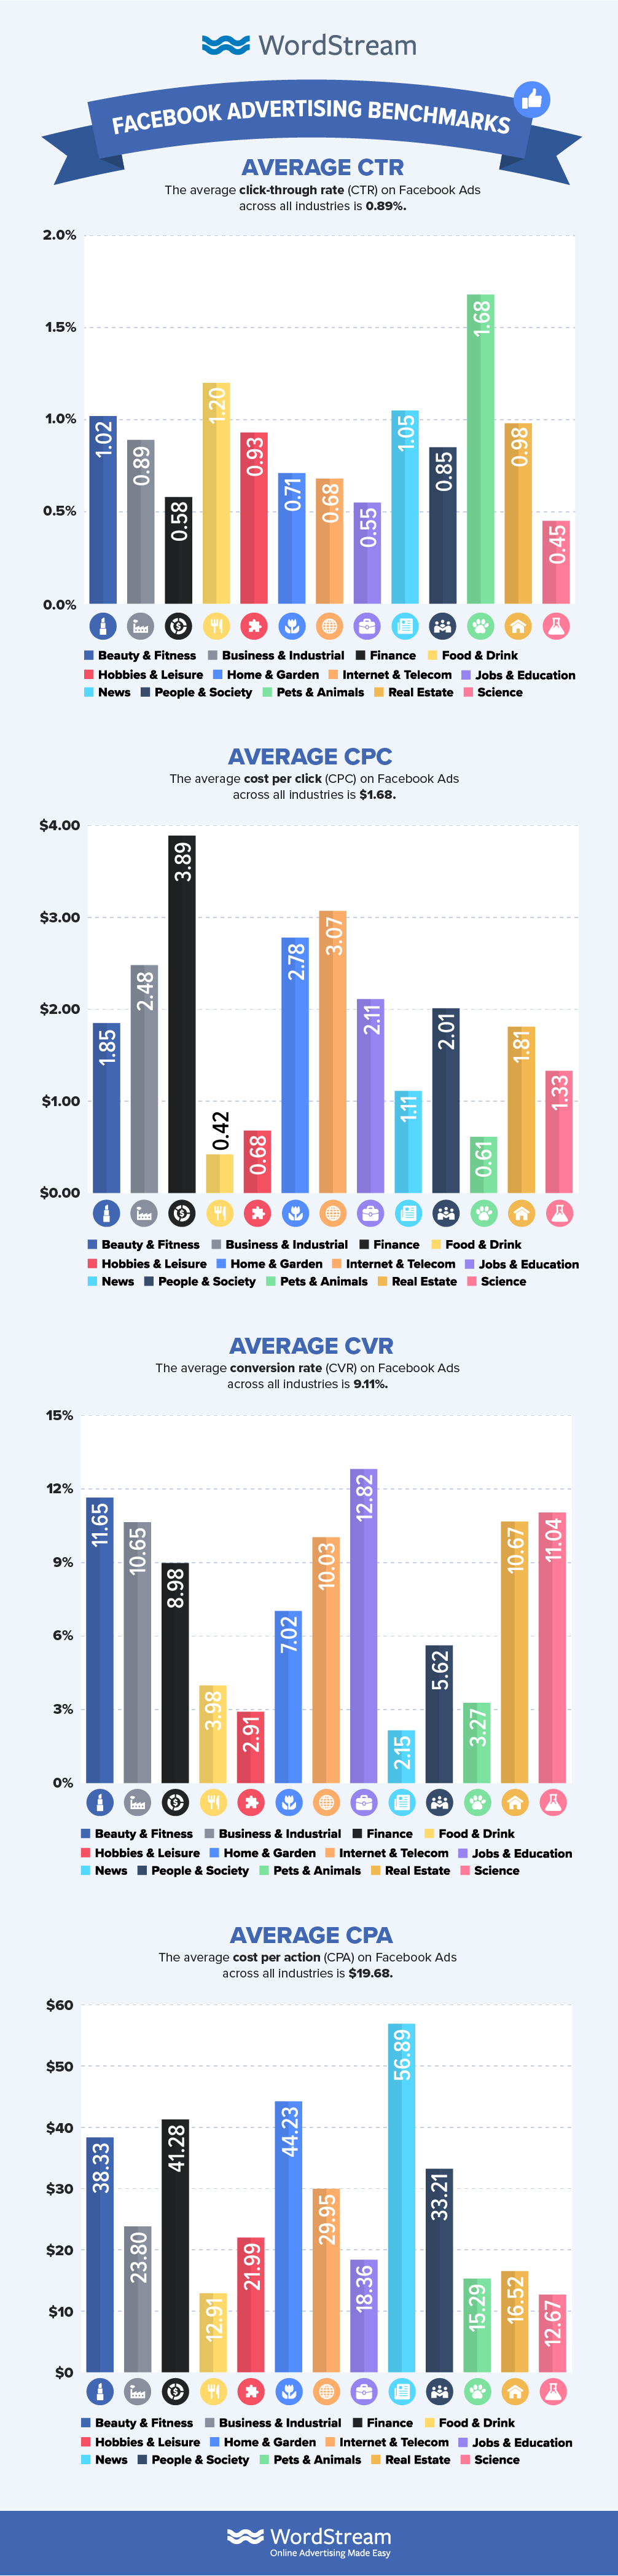
Average click-through rate on Facebook by industry
The average Click-Through Rate (CTR) on Facebook Ads is 0.89% across all industries.
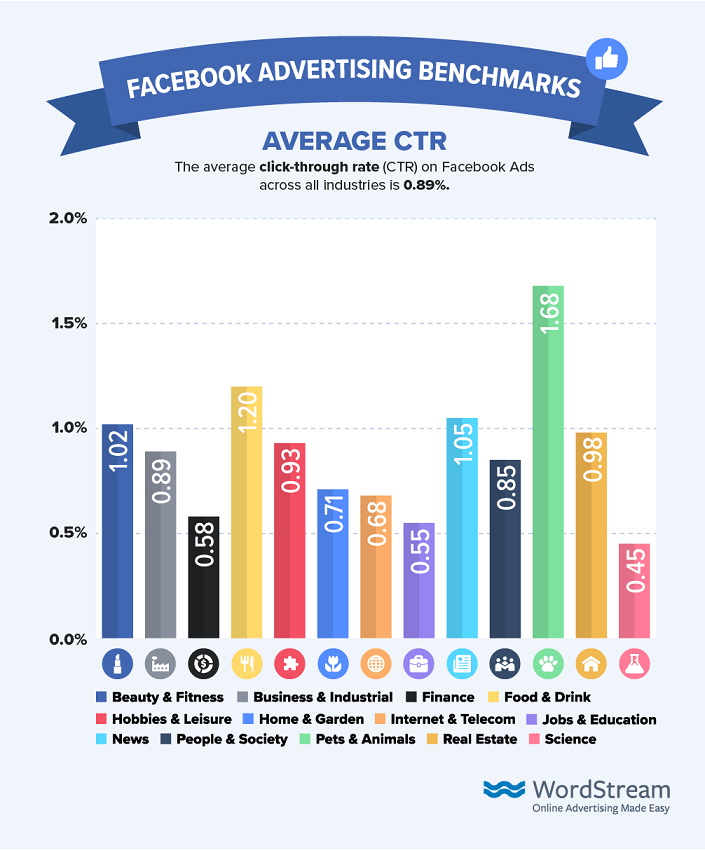
Cute cat photos are a staple of the internet, so it’s no surprise that we see Pets & Animals earn the highest CTR on their ads with an average 1.68% CTR, nearly double the average! Facebook & Instagram are no strangers to Food & Drink, or Beauty & Fitness influencers, so it should be no surprise that their ads achieve similarly high click-through rates (1.2% and 1.02%, respectively). Ads that are news-worthy similarly are very engaging with their audiences on Facebook, averaging a 1.05% CTR.
Jobs & Education ads struggle to find engagement on Facebook, with about half the engagement of other ads (0.55% CTR). Science advertisers perform the worst on their social feeds—with a 0.45% CTR. These professional audiences may perform much better on a network like Linkedin Ads.
The average click-through rate on Facebook across all industries is 0.89%.
| Industry | Average CTR |
| Beauty & Fitness | 1.02% |
| Business & Industrial | 0.89% |
| Finance | 0.58% |
| Food & Drink | 1.20% |
| Hobbies & Leisure | 0.93% |
| Home & Garden | 0.71% |
| Internet & Telecom | 0.68% |
| Jobs & Education | 0.55% |
| News | 1.05% |
| People & Society | 0.85% |
| Pets & Animals | 1.68% |
| Real Estate | 0.98% |
| Science | 0.45% |
Average cost per click on Facebook by industry
The average cost per click (CPC) on Facebook ads is $1.68 across all industries.
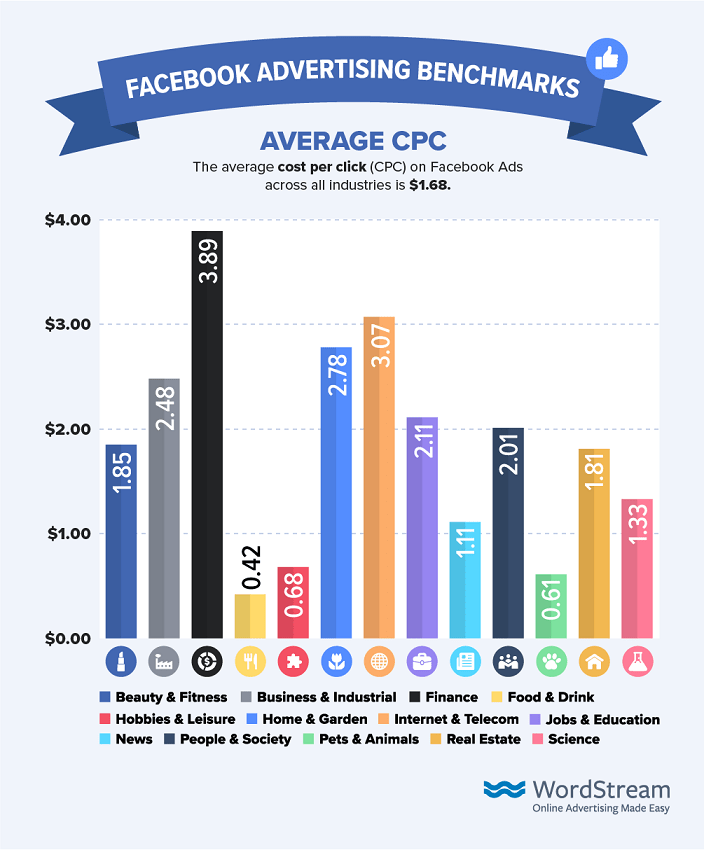
Just like on Google, Financial advertisers have the highest CPC on Facebook ads with an average cost per click of $3.89. Even at these relatively high costs on Facebook, that’s certainly a relief compared to their costs on Google, where many financial terms make up some of most expensive keywords on Google, each costing about $50 per click. Other expensive industries on Facebook, such as Internet & Telecom and Business & Industrial, have high costs on Google as well.
The cheapest clicks on Facebook are from the industries with the highest CTRs—Food & Drink have an average CPC of $0.42, and Pets & Animals at $0.61 per click. This clearly illustrates the value of a focusing on creating high CTR ads and their effects on reducing your costs.
The average cost per click (CPC) on Facebook Ads is $1.68 across all industries.
| Industry | Average CPC |
| Beauty & Fitness | $1.85 |
| Business & Industrial | $2.48 |
| Finance | $3.89 |
| Food & Drink | $0.42 |
| Hobbies & Leisure | $0.68 |
| Home & Garden | $2.78 |
| Internet & Telecom | $3.07 |
| Jobs & Education | $2.11 |
| News | $1.11 |
| People & Society | $2.01 |
| Pets & Animals | $0.61 |
| Real Estate | $1.81 |
| Science | $1.33 |
Average conversion rates on Facebook by industry
The average conversion rate (CVR) on Facebook Ads is 9.11% across all industries.
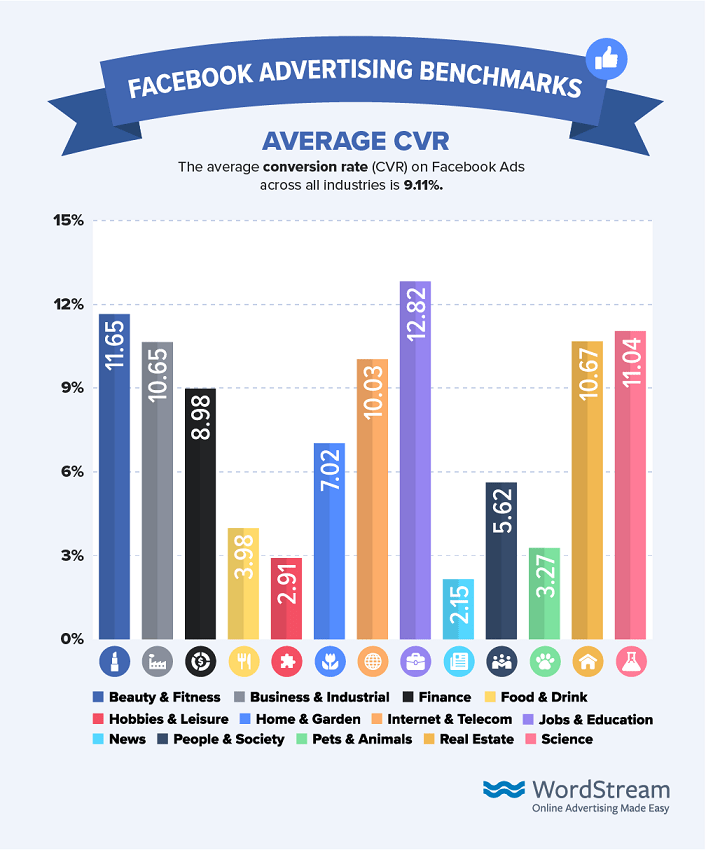
Although it may be hard to distract potential job hunters from their social feeds, we see that when it’s done right it can be a very effective strategy and yield very high conversion rates—converting about one out of eight people that arrive on your site. Many other industries convert more than 10% of all the users who click on their ads!
A notable exception to this trend is with sponsored ads for News articles, which boast higher CTR but very low conversion rates (2.15%). It’s very possible that many of these advertisers are not looking to get users to convert immediately but change their path to conversion or get them to take some offline action after reading a relevant article.
The average conversion rate (CVR) on Facebook Ads is 9.11% across all industries.
| Industry | Average CVR |
| Beauty & Fitness | 11.65% |
| Business & Industrial | 10.65% |
| Finance | 8.98% |
| Food & Drink | 3.98% |
| Hobbies & Leisure | 2.91% |
| Home & Garden | 7.02% |
| Internet & Telecom | 10.03% |
| Jobs & Education | 12.82% |
| News | 2.15% |
| People & Society | 5.62% |
| Pets & Animals | 3.27% |
| Real Estate | 10.67% |
| Science | 11.04% |
Average cost per action on Facebook by industry
The average cost per acquisition (CPA) on Facebook Ads is $19.68 across all industries.
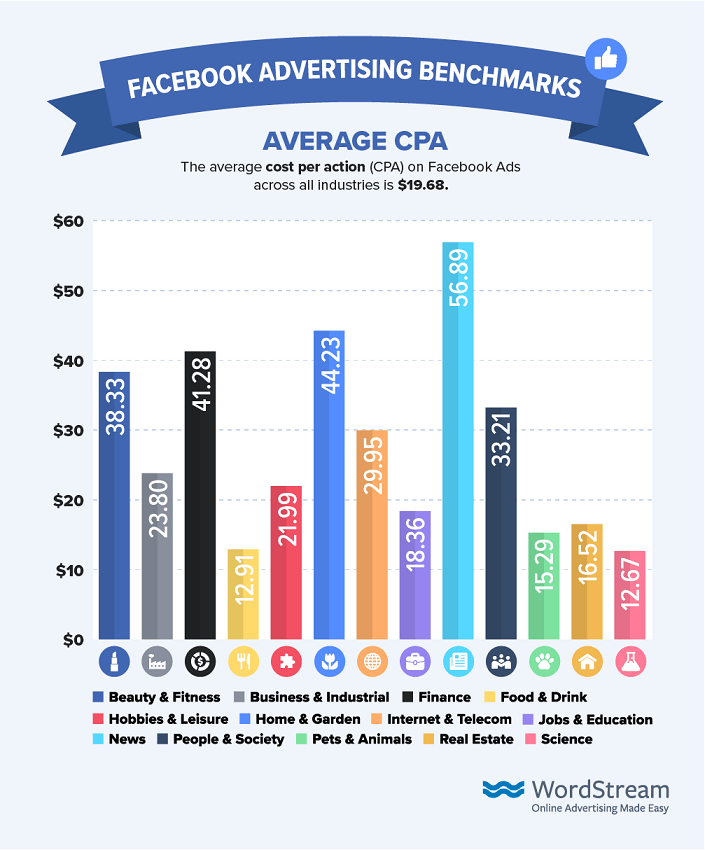
There’s a reason why more and more SMBs are turning to Facebook ads—they work! Food & Drink advertisers find their next dinners on Facebook for a particularly low cost of $12.91. That CPA is particularly low when you consider the high lifetime value of a new regular patron!
However, some advertisers with longer purchasing cycles—like Home & Garden or Finance may have a higher CPA than their FMCG peers, with an average CPA of $44.23 and $41.28 respectively. Given how long it may take people to shop around before ultimately making a large purchase like this, it’s particularly important to advertise on multiple networks to keep your brand top of mind!
The average CPA on Facebook across all industries is $19.68.
| Industry | Average CPA |
| Beauty & Fitness | $38.33 |
| Business & Industrial | $23.8 |
| Finance | $41.28 |
| Food & Drink | $12.91 |
| Hobbies & Leisure | $21.99 |
| Home & Garden | $44.23 |
| Internet & Telecom | $29.95 |
| Jobs & Education | $18.36 |
| News | $56.89 |
| People & Society | $33.21 |
| Pets & Animals | $15.29 |
| Real Estate | $16.52 |
| Science | $12.67 |
What does it all mean?
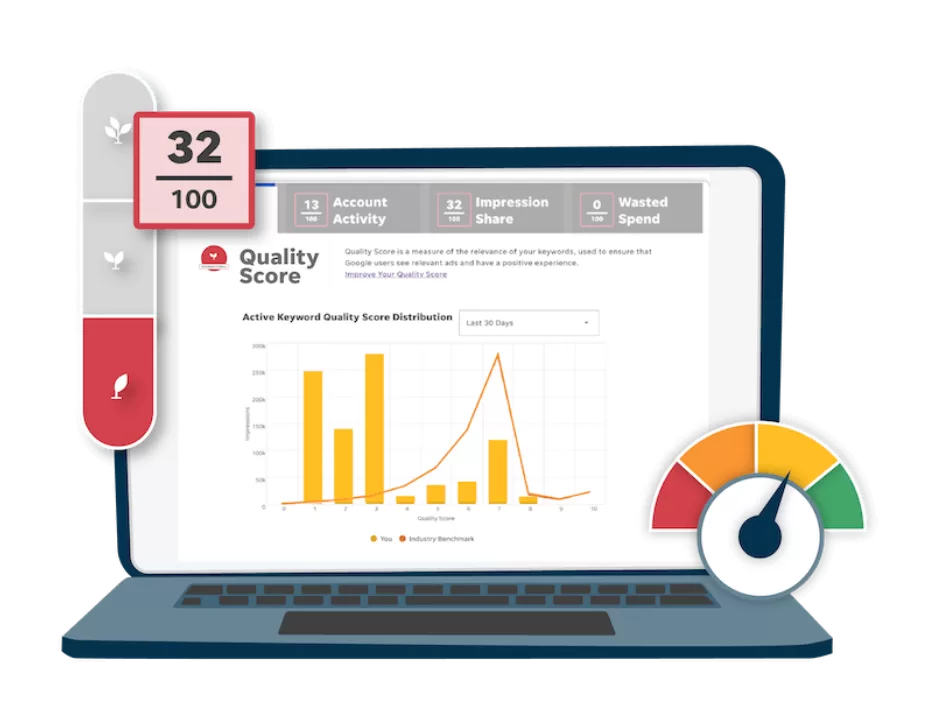
As more than 7 million advertisers flock to Facebook, it’s important to understand how to succeed on the network. If you’re interested in learning more about how your Facebook ads compare to your competition, take our Facebook Ads Performance Grader to see how your ads stack up against others just like you—and how to improve them!
Data sources
Firstly, a big thank you to our product analyst Mallory Harper for running this new data! This report is based on a sample of 8,287 US-based accounts in all verticals (representing $9.3M in aggregate Facebook spend) between November 1, 2016 and July 31, 2019. Facebook campaigns can have several different objectives, so only Facebook campaigns with the objective of driving conversions were considered when determining average CVR and CPA numbers. Average figures are median figures to account for outliers. All currency values are posted in USD.
If you’re advertising on search or social (or better yet, both!), you can check out our always-updated online advertising benchmarks or any of our other reports:
- Google Ads Benchmarks for YOUR Industry
- Google Shopping Ad Benchmarks for YOUR industry
- Google Ads Mobile Benchmarks for YOUR Industry
- Google Shopping Forecasts for YOUR industry
- Bing Ads Benchmarks for YOUR Industry

Meet The Author
Mark Irvine
Mark is the Director of PPC at SearchLab Digital. Previously, Mark worked at WordStream and was named the Most Influential PPC Expert of the Year by both PPC and Microsoft.