It’s a mobile-first world. This year, 52.2 percent of all website traffic worldwide has come from mobile devices. Google rolled out its mobile-geared Speed Update to all users in July; and just a few days later, announced the release of Mobile Landing Page Speed Score in the Google Ads UI. The search marketing world is adapting rapidly to keep up with the influx in mobile usage, and outflanking competitors in your mobile search and display campaigns is more important than ever. But it can also be confusing.
What are the numbers you should be looking to beat? What’s a good click-through rate for mobile ads? What’s a good conversion rate on mobile devices? And what about costs: What are the average costs for Google Ads on mobile? We dug into our data to find out!
From our vast pool of client accounts, we’ve pulled the following benchmarks for Google Ads (formerly known as AdWords) running on mobile devices:
- Average Mobile Click-Through Rate (CTR) in Google Ads by industry, for both Search and Display
- Average Mobile Cost per Click (CPC) in Google Ads by industry, for both Search and Display
- Average Mobile Conversion Rate (CVR) in Google Ads by industry, for both Search and Display
- Average Mobile Cost per Action (CPA) in Google Ads by industry, for both Search and Display
In this post, you’ll find averages for each of these metrics across eighteen industries: Arts & Entertainment, Automotive Service & Repair, Business Services, Computer & Electronics, Construction, Education, Finance, Hair Salons, Healthcare, Home & Garden, Internet & Telecom, Law/Legal, Consulting, Manufacturing, Nonprofits, Retail, Transportation, and Travel & Hospitality.
Let’s take a closer look at each set of benchmarks. (And if you’re interested in how this data breaks out by ad type, don’t hesitate to check out our Google Mobile Benchmarks – by Ad Type)!
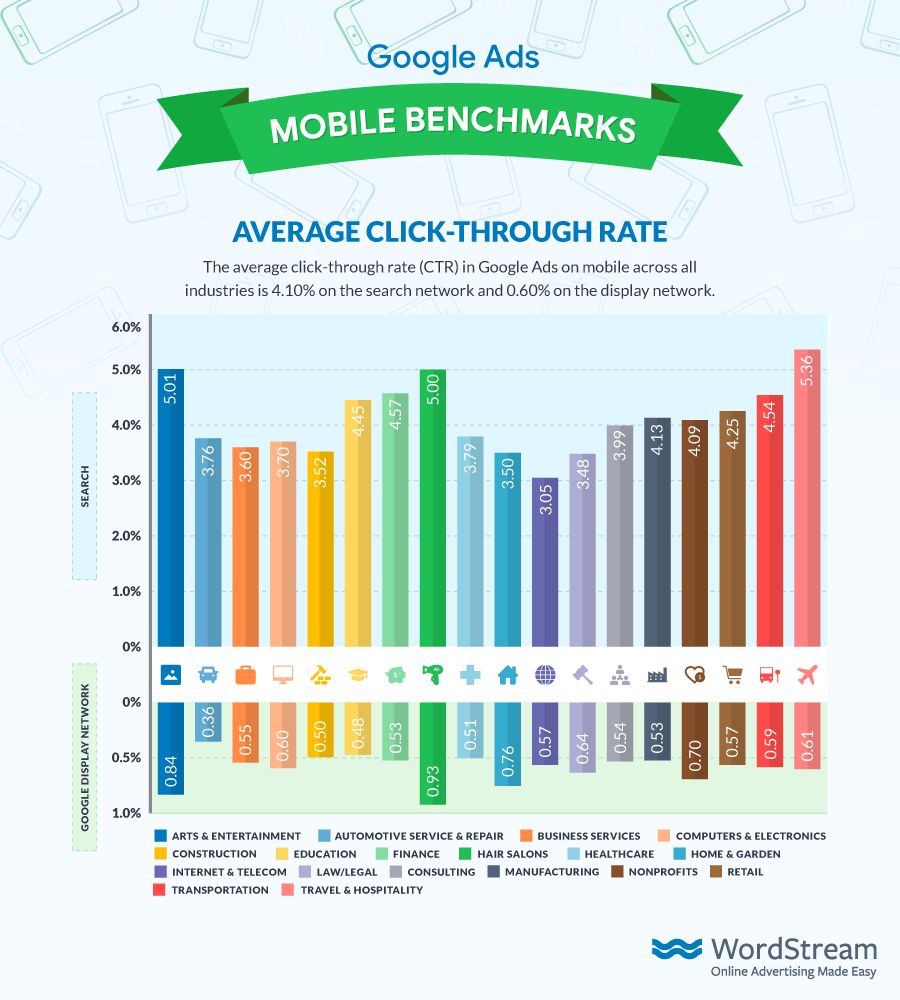
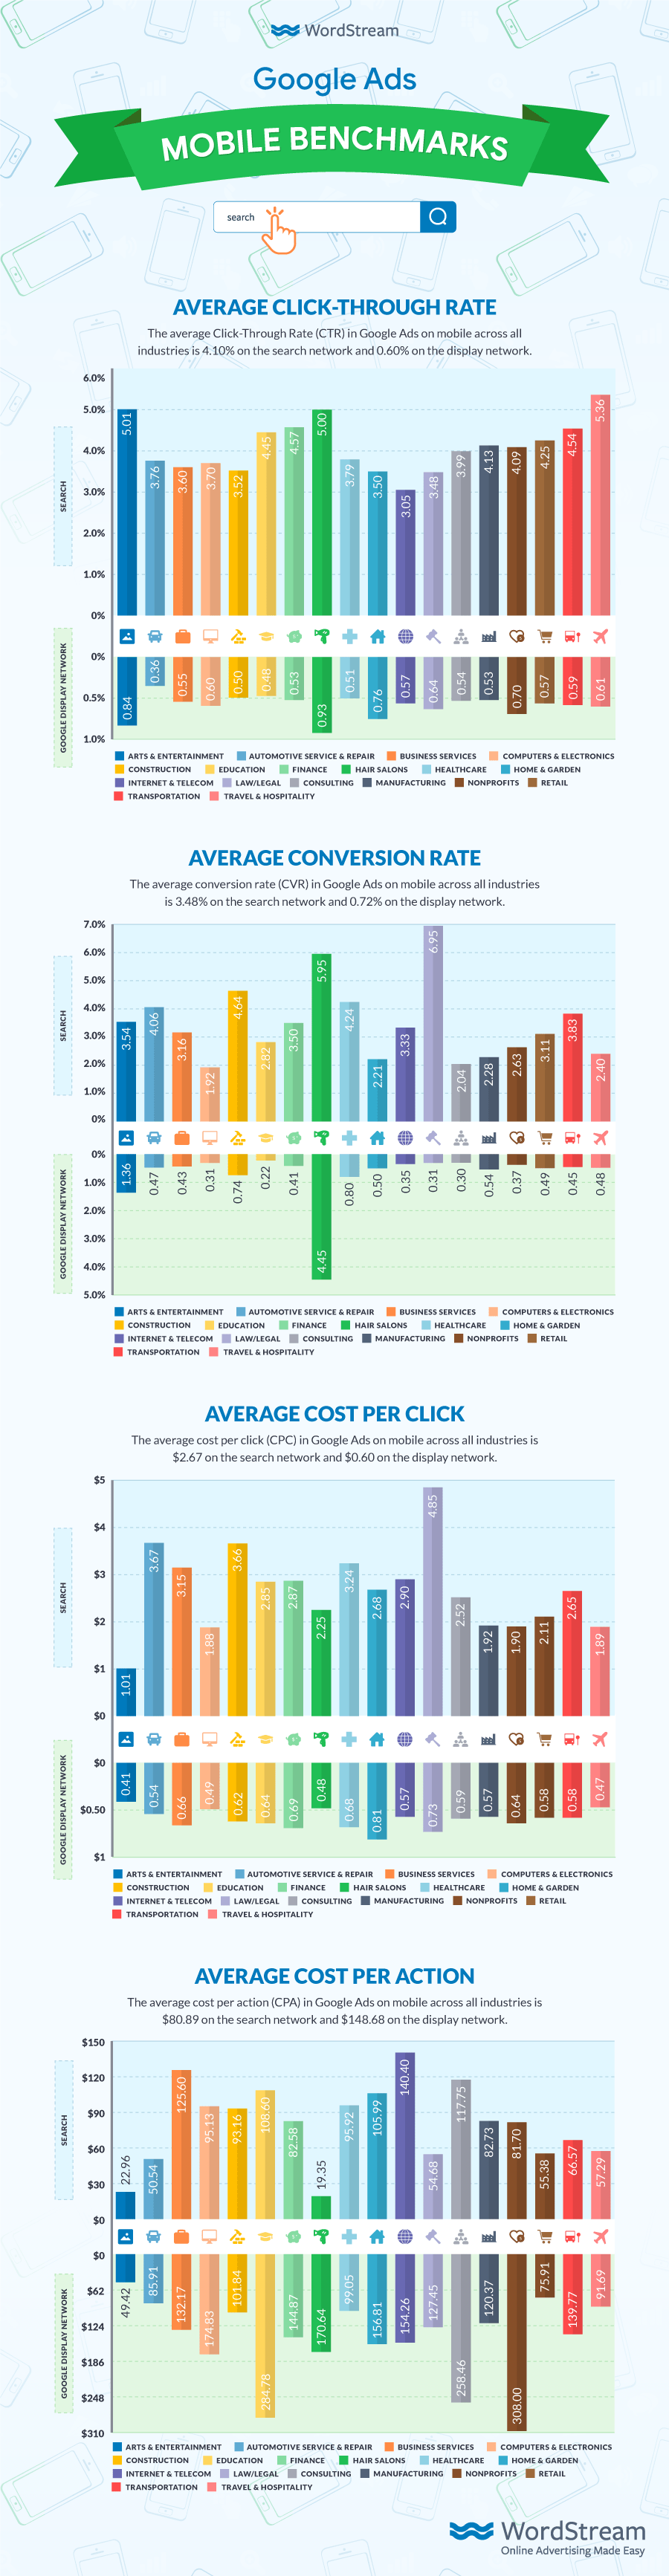
Average Mobile Click-Through Rate in Google Ads by Industry
The highest mobile click-through rate of any industry on the Search Network? Travel & Hospitality, at 5.36%. This is not entirely surprising. In our much-heralded original Google Ads Benchmarks, in which we measured click-through rate across mobile and desktop, Travel & Hospitality came in at 4.68% on the Search Network—good for second, behind Dating & Personals.
Second in mobile click-through rate (search) across industries we measured was Arts & Entertainment. If a theme can be gleaned here, it’s this: among the metrics we measured, click-through rate aligns most closely with attractive/provocative creative. Travel, Entertainment, Dating—these are all niches that afford advertisers the opportunity to leverage enticing copy. To go a step further—they demand enticing copy.
The average click-through rate in Google Ads on mobile across all industries is 4.10% on the search network and 0.60% on the display network.
When desktop is factored in, click-through rates across search and display are both lower—3.17% and 0.46%, respectively—than mobile-exclusive click-through rates.
Average Mobile CTR
| Industry | Average Mobile CTR (Search) | Average Mobile CTR (Display) |
|---|---|---|
| Arts & Entertainment | 5.01% | 0.84% |
| Automotive Service & Repair | 3.76% | 0.36% |
| Business Services | 3.60% | 0.55% |
| Computers & Electronics | 3.70% | 0.60% |
| Construction | 3.52% | 0.50% |
| Consulting | 3.99% | 0.54% |
| Education | 4.45% | 0.50% |
| Finance | 4.57% | 0.53% |
| Hair Salons | 5.00% | 0.93% |
| Healthcare | 3.79% | 0.51% |
| Home & Garden | 3.50% | 0.76% |
| Internet & Telecom | 3.05% | 0.57% |
| Law/Legal | 3.48% | 0.64% |
| Manufacturing | 4.13% | 0.53% |
| Non-profits | 4.09% | 0.70% |
| Retail | 4.25% | 0.57% |
| Transportation | 4.54% | 0.59% |
| Travel & Hospitality | 5.36% | 0.61% |
Average Mobile Cost Per Click in Google Ads by Industry
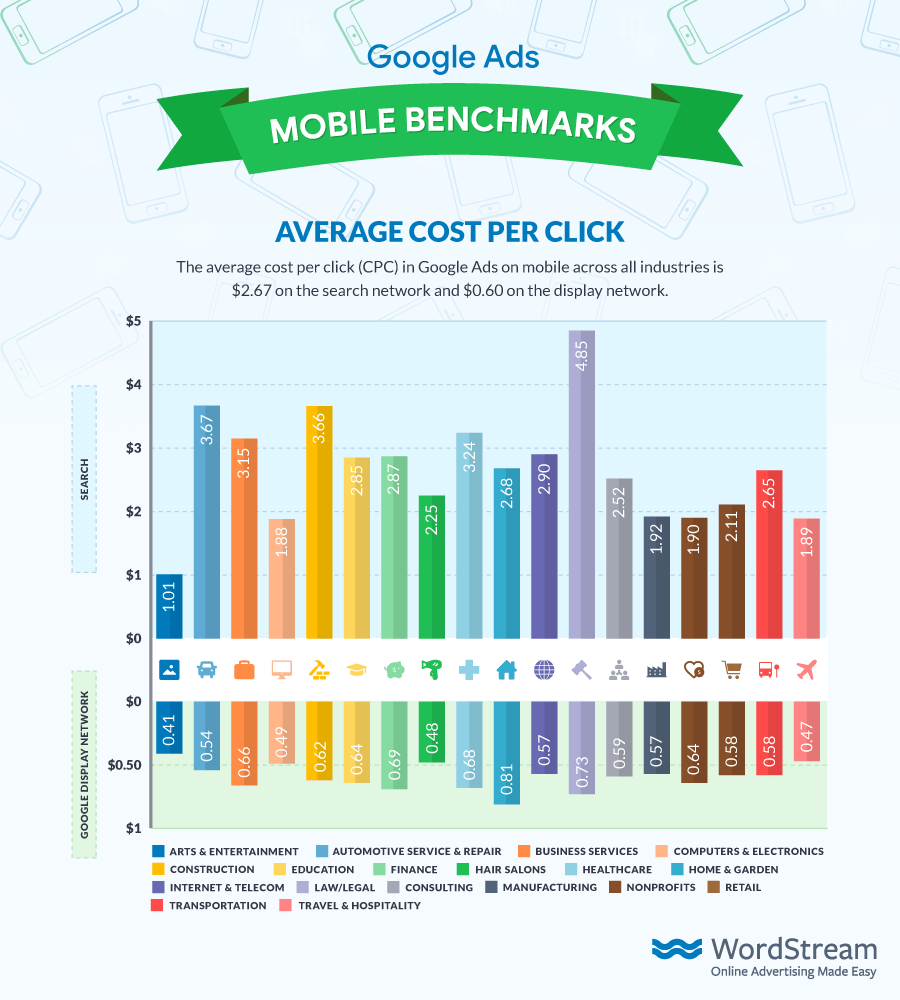
In keeping with our desktop-inclusive benchmarks, the Law/Legal industry has the highest mobile cost per click (CPC) in search. This isn’t much of a surprise—“lawyer” is the fourth most expensive keyword in Google Ads ($54.86), according to data pulled by our Free Keyword Tool. It goes without saying that similar keywords will be similarly expensive; and that, as a result, CPCs across the niche will be bloated.
In display, Arts & Entertainment boasts the lowest CPC at $0.41. Given the strong correlation between CTR and CPC, it’s no surprise that Travel & Hospitality comes in at $0.47 (good for second), and that both industries are among the top three lowest search CPCs.
The average cost per click in Google Ads on mobile across all industries is $2.67 on the search network and $0.60 on the display network.
Desktop-inclusive CPCs for search and display ($2.69 and $0.63, respectively) would suggest that mobile does not represent a huge departure from desktop in terms of industry-wide CPCs.
Average Mobile CPC
| Industry | Average Mobile CPC (Search) | Average Mobile CPC (Display) |
|---|---|---|
| Arts & Entertainment | $1.01 | $0.41 |
| Automotive Service & Repair | $3.67 | $0.54 |
| Business Services | $3.15 | $0.66 |
| Computers & Electronics | $1.88 | $0.49 |
| Construction | $3.66 | $0.62 |
| Consulting | $2.52 | $0.59 |
| Education | $2.85 | $0.64 |
| Finance | $2.87 | $0.69 |
| Hair Salons | $2.25 | $0.48 |
| Healthcare | $3.24 | $0.68 |
| Home & Garden | $2.68 | $0.81 |
| Internet & Telecom | $2.90 | $0.57 |
| Law/Legal | $4.85 | $0.73 |
| Manufacturing | $1.92 | $0.57 |
| Non-profits | $1.90 | $0.64 |
| Retail | $2.11 | $0.58 |
| Transportation | $2.65 | $0.58 |
| Travel & Hospitality | $1.89 | $0.47 |
Average Mobile Conversion Rates in Google Ads by Industry
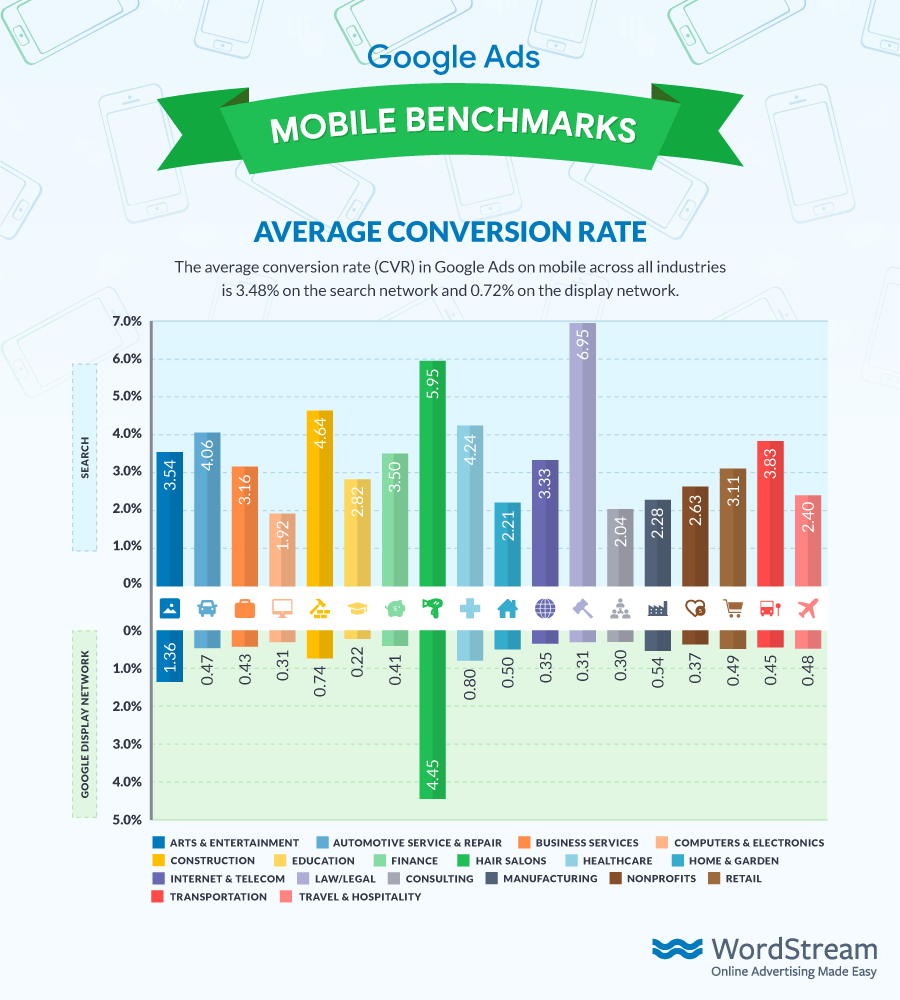
Hair Stylists rejoice! Conversion rates (CVRs) among Hair Salons were substantially higher than those in any other industry; and in display, they were over 3 times as high as the next highest (Arts & Entertainment, what’s new). On the search side, Law/Legal experienced near-outlier rates of conversion (6.95%), and Construction also came in well above average (4.64%).
Much like its desktop-inclusive conversion rate, Education came in well below average in both search conversion rate (2.82%) and display conversion rate (0.22%), with its display conversion rate representing the lowest of any industry. With expensive keywords, long sales cycles, and some advertising restrictions, education marketing can be a challenge.
Travel & Hospitality conversion rates show that high CTRs and low CPCs don’t necessarily tell the whole story—customers are doing more searches than ever prior to booking travel. The Travel industry is proof that clicks don’t always translate to conversions. Travel advertisers should prioritize bidding on keywords with high-intent search signals.
The average conversion rate in Google Ads on mobile across all industries is 3.48% on the search network and 0.72% on the display network.
Desktop-inclusive CVRs for search and display (3.75% and 0.77%, respectively) suggest that, in general, CVRs are still a little lower on mobile devices.
Average Mobile CVR
| Industry | Average Mobile CVR (Search) | Average Mobile CVR (Display) |
|---|---|---|
| Arts & Entertainment | 3.54% | 1.36% |
| Automotive Service & Repair | 4.06% | 0.47% |
| Business Services | 3.16% | 0.43% |
| Computers & Electronics | 1.92% | 0.31% |
| Construction | 4.64% | 0.74% |
| Consulting | 2.04% | 0.30% |
| Education | 2.82% | 0.22% |
| Finance | 3.50% | 0.41% |
| Hair Salons | 5.95% | 4.45% |
| Healthcare | 4.24% | 0.80% |
| Home & Garden | 2.21% | 0.50% |
| Internet & Telecom | 3.33% | 0.35% |
| Law/Legal | 6.95% | 0.31% |
| Manufacturing | 2.28% | 0.54% |
| Non-profits | 2.63% | 0.37% |
| Retail | 3.11% | 0.49% |
| Transportation | 3.83% | 0.45% |
| Travel & Hospitality | 2.40% | 0.48% |
Average Mobile Cost Per Action in Google Ads by Industry
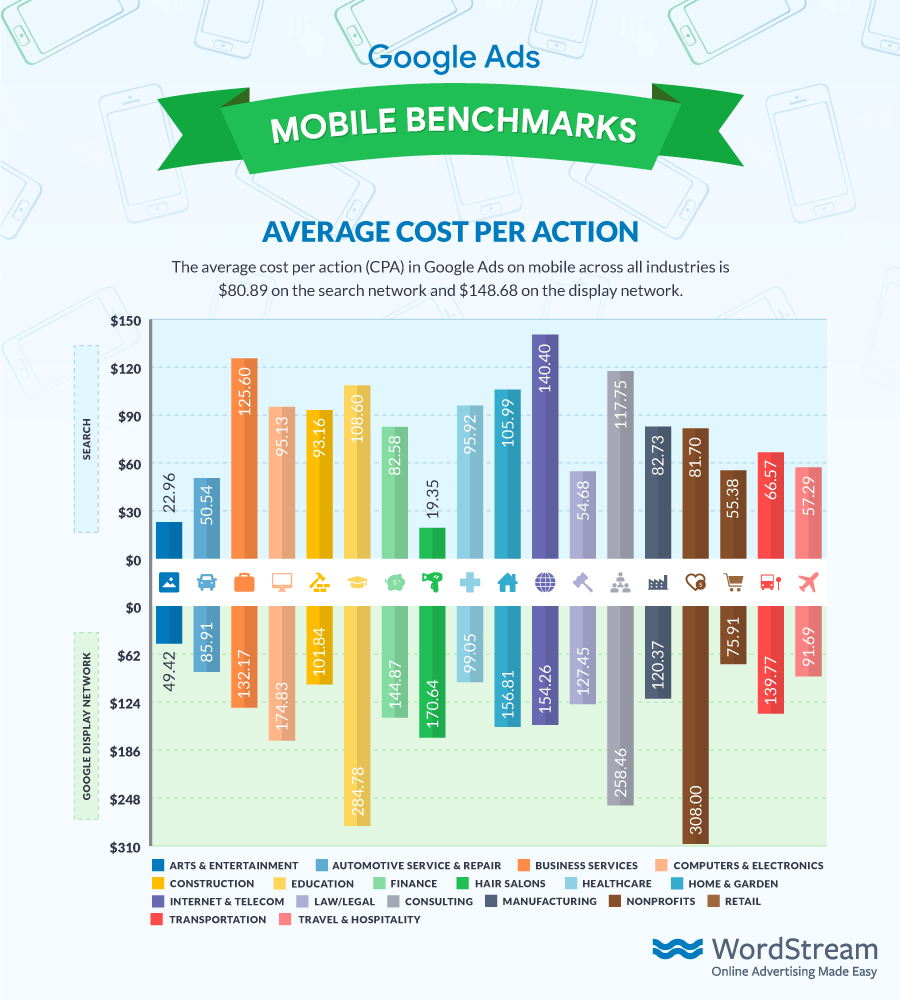
Much like the inverse relationship between CPC and CTR, we can track an inverse relationship between CVR and cost per action (CPA). Generally speaking, industries with lower-than-average CVRs saw higher-than-average CPAs.
Higher display CPAs in Consulting and Education could be the result of less obviously appealing visuals to promote specific actions. We see the same trend in Education CPAs in our desktop-inclusive benchmarks.
The average cost per action in Google Ads on mobile across all industries is $80.89 on the search network and $148.68 on the display network.
Desktop-inclusive CPAs for search and display (48.96% and 75.51%, respectively) suggest that, in general, CPAs are much higher on mobile devices. If you’re using CPA bidding in your campaigns, make sure you’re not hemorrhaging ad spend on mobile.
Average Mobile CPA
| Industry | Average Mobile CPA (Search) | Average Mobile CPA (Display) |
|---|---|---|
| Arts & Entertainment | $22.96 | $49.42 |
| Automotive Service & Repair | $50.54 | $85.91 |
| Business Services | $125.60 | $132.17 |
| Computers & Electronics | $95.13 | $174.83 |
| Construction | $93.16 | $104.84 |
| Consulting | $117.75 | $258.46 |
| Education | $108.60 | $284.78 |
| Finance | $82.58 | $144.87 |
| Hair Salons | $19.35 | $170.64 |
| Healthcare | $95.92 | $99.05 |
| Home & Garden | $105.99 | $156.81 |
| Internet & Telecom | $140.40 | $154.26 |
| Law/Legal | $54.68 | $127.45 |
| Manufacturing | $82.73 | $120.37 |
| Non-profits | $81.70 | $308.00 |
| Retail | $55.38 | $75.91 |
| Transportation | $66.57 | $139.77 |
| Travel & Hospitality | $57.29 | $91.69 |
Some Context
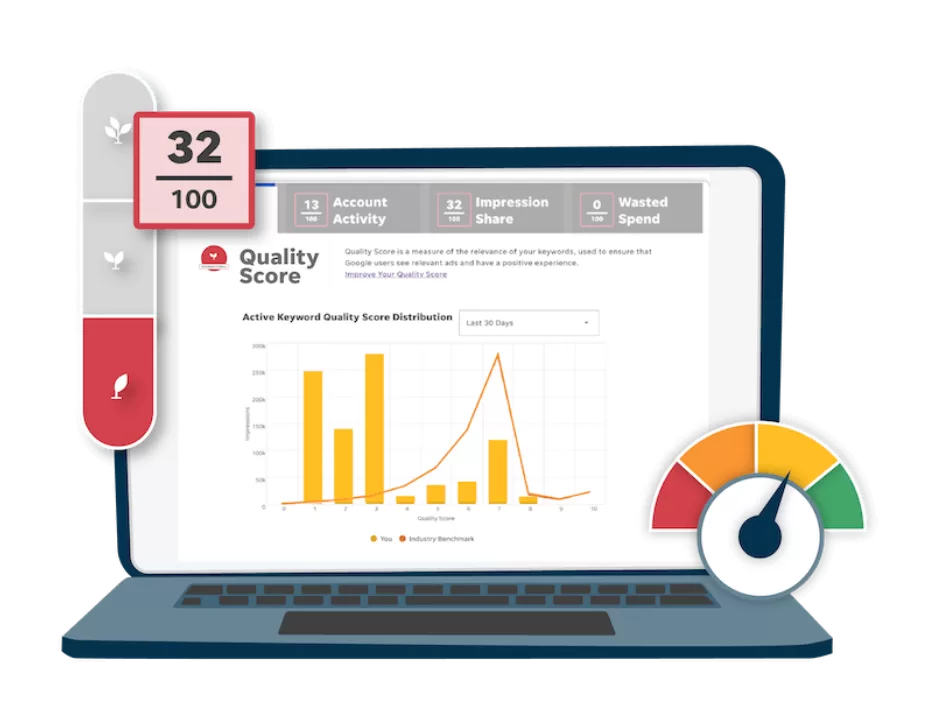
While what’s true for our clients may not be true for all advertisers, we stand by these benchmarks as solid indicators of your Google Ads mobile competition. Still: don’t sweat it if you don’t quite match up to your industry benchmark in a given metric! Our AdWords Performance Grader is a terrific, free tool that analyzes your account and provides an assessment on the areas in which you’re falling short.
Check out the full infographic below.
Data Sources:
This report is based on a sample of 20,297 US-based WordStream client accounts in all verticals (representing a little over $139 million in aggregate Google Ads spend) who were advertising on Google’s Search and Display networks in the 2017 calendar year. Each industry includes at minimum 35 unique active clients. “Averages” are technically median figures to account for outliers. All currency values are posted in USD.
A huge shout out and thanks to our Data Analyst Patrick Henry Carrera for pulling these numbers!
You may also be interested in:

Meet The Author
Gordon Donnelly
Gordon Donnelly is the founder of Powerplay. He is passionate about using AI, automation, and behavioral data to help B2B teams engineer repeatable pipelines and drive revenue. When he’s not helping startups go-to-market, you can find him hanging out in the lineup at Venice Breakwater.