In today’s day and age, when we want to buy something, our knee-jerk reaction is to head to Google (or whatever search engine we use). Whether we know exactly what we want, are looking for nearby businesses, or want to do more in-depth research, 71% of buyer journeys begin with a search engine.
In other words, consumers have the highest purchase intent when on search engines. This is why paid search ads are so highly effective—and yet so competitive.
In order to compete, you need to have a clear picture of your performance in relation to others in your industry. To help you with this, WordStream and LOCALiQ have partnered up to provide you with the benchmark data you need!
Below you will find the following metrics across the top 20 industries for Google and Bing search ads:
- Average cost per click
- Average click-through rate
- Average cost per lead
- Average conversion rate
Compare your averages to those in your industry and get a solid read on where you need to improve to stay competitive and keep your Google Ads costs low.
🛑 Update: Check out our 2024 Search Advertising Benchmarks! >>
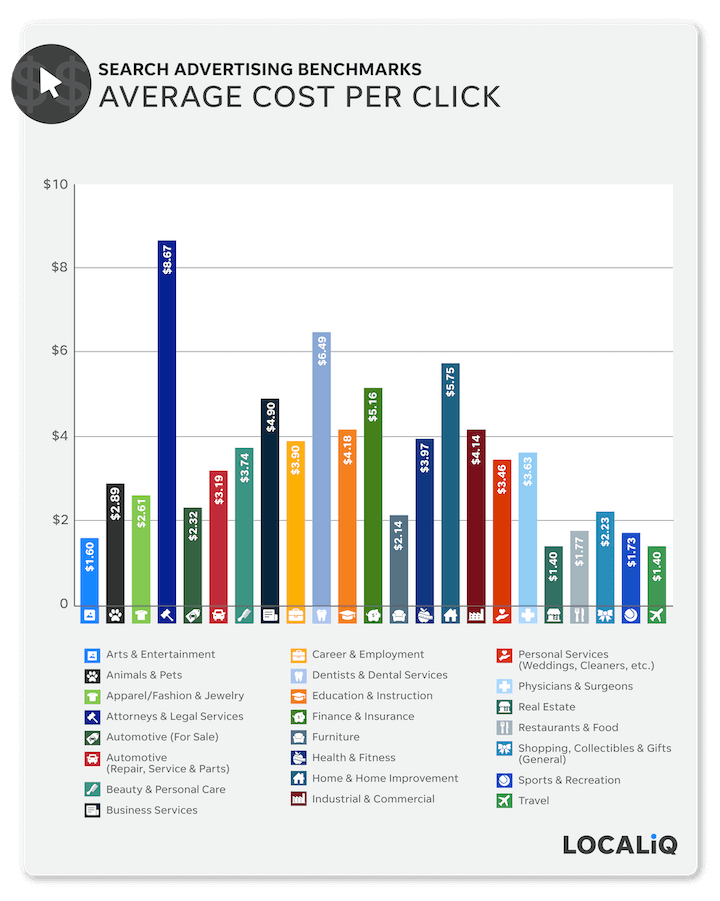
Average cost per click for search advertising
| Business Category | Average Cost Per Click |
| Arts & Entertainment | $1.60 |
| Animals & Pets | $2.89 |
| Apparel / Fashion & Jewelry | $2.61 |
| Attorneys & Legal Services | $8.67 |
| Automotive — For Sale | $2.32 |
| Automotive — Repair, Service & Parts | $3.19 |
| Beauty & Personal Care | $3.74 |
| Business Services | $4.90 |
| Career & Employment | $3.90 |
| Dentists & Dental Services | $6.49 |
| Education & Instruction | $4.18 |
| Finance & Insurance | $5.16 |
| Furniture | $2.14 |
| Health & Fitness | $3.97 |
| Home & Home Improvement | $5.75 |
| Industrial & Commercial | $4.14 |
| Personal Services | $3.46 |
| Physicians & Surgeons | $3.63 |
| Real Estate | $1.40 |
| Restaurants & Food | $1.77 |
| Shopping, Collectibles & Gifts | $2.23 |
| Sports & Recreation | $1.73 |
| Travel | $1.40 |
Cost per click varies according to the level of competition for a keyword, audience, location, and more, and your bidding strategy can impact this metric.
- We found the average cost per click for search ads across all industries to be $3.53, ranging from $1.40 to $8.67.
- Industries with the lowest CPC include travel ($1.40), arts and entertainment ($1.60), and sports and recreation ($1.73).
- Industries with the highest average CPC include attorneys and legal services ($8.67), dentists and dental services ($6.49), and home and home improvement ($5.75).
These findings are consistent with our past benchmarks reports, with the legal industry having the highest cost per click and sports and fitness being among the industries with the lowest.
Need to improve your cost per click?
- Choose your keywords wisely (not just the cheapest ones!).
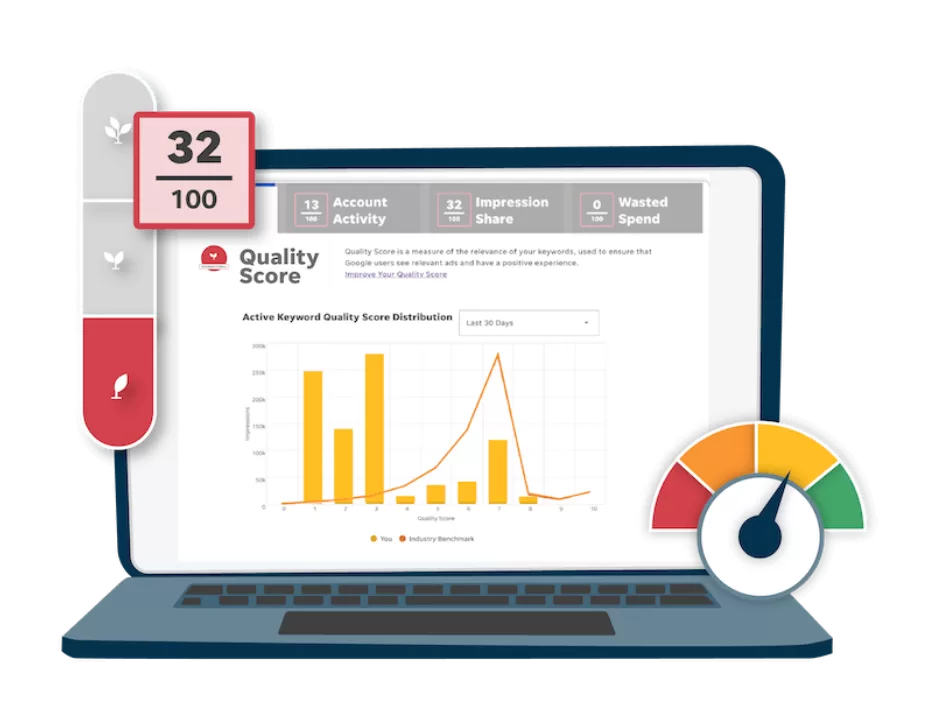
- Improve your Quality Score.
- Keep a solid negative keyword list .
For more tips, check out 15 Ways to Lower your Cost Per Click in Google & Facebook Ads
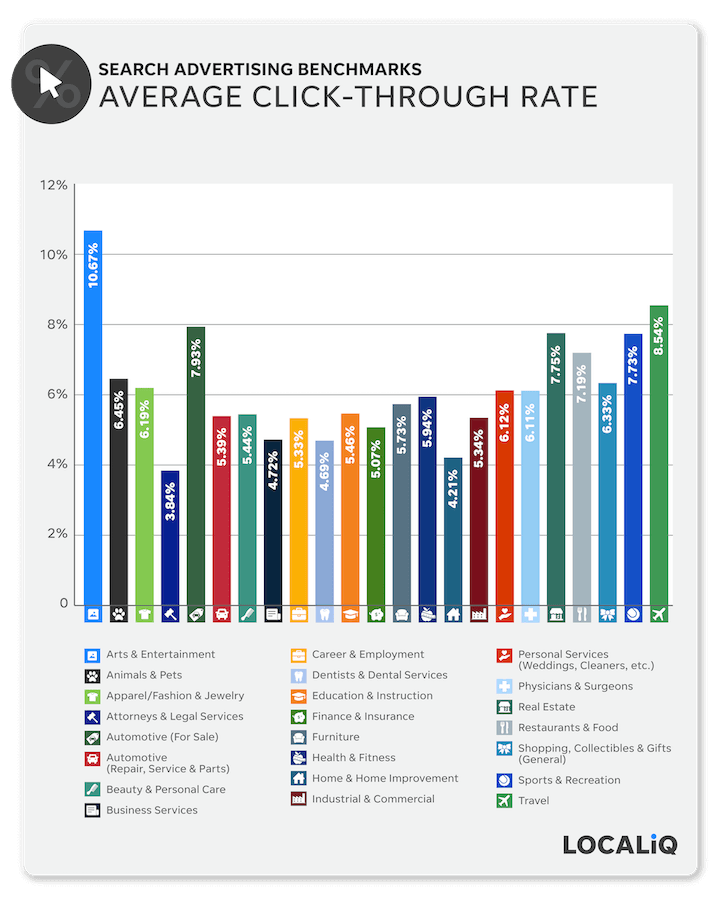
Average click-through rate for search advertising
| Business Category | Average Click-Through Rate |
| Arts & Entertainment | 10.67% |
| Animals & Pets | 6.45% |
| Apparel / Fashion & Jewelry | 6.19% |
| Attorneys & Legal Services | 3.84% |
| Automotive — For Sale | 7.93% |
| Automotive — Repair, Service & Parts | 5.39% |
| Beauty & Personal Care | 5.44% |
| Business Services | 4.72% |
| Career & Employment | 5.33% |
| Dentists & Dental Services | 4.69% |
| Education & Instruction | 5.46% |
| Finance & Insurance | 5.07% |
| Furniture | 5.73% |
| Health & Fitness | 5.94% |
| Home & Home Improvement | 4.21% |
| Industrial & Commercial | 5.34% |
| Personal Services | 6.12% |
| Physicians & Surgeons | 6.11% |
| Real Estate | 7.75% |
| Restaurants & Food | 7.19% |
| Shopping, Collectibles & Gifts | 6.33% |
| Sports & Recreation | 7.73% |
| Travel | 8.54% |
How do you measure up? How can you improve?
Find out instantly with the Free Google Ads Performance Grader.
Click-through rate factors into your Quality Score and guides you in identifying the right targeting, ad copy, and offers for your ads. The metric can be misleading by itself, so be sure to analyze it with respect to other metrics (like conversion rate).
- We found the average click-through rate across all industries to be 6.18%, ranging from 3.84% to 10.67%.
- Industries with the highest average click-through rates include arts and entertainment (10.67%), travel (8.54%), and real estate (7.75%)—with sports and recreation just behind that (7.73%).
- Industries with the lowest average click-through rates include attorneys and legal services (3.84%), home and home improvement (4.21%), and dentists and dental services (4.69%).
In our previous benchmarks reports, we have consistently found the highest click-through rates in the travel and arts industries, and the lowest with legal, health, and home industries.
On the other hand, sports and fitness have historically had lower click-through rates than what we’re seeing here, and the personals vertical has shown significantly higher click-through rates than these numbers.
Want a better click-through rate?
- Follow our 8 Best Ad Copywriting Tips…Ever!
- Check out these secrets behind ads with 3x higher-than-average CTRs.
- Learn why you have a poor click-through rate.
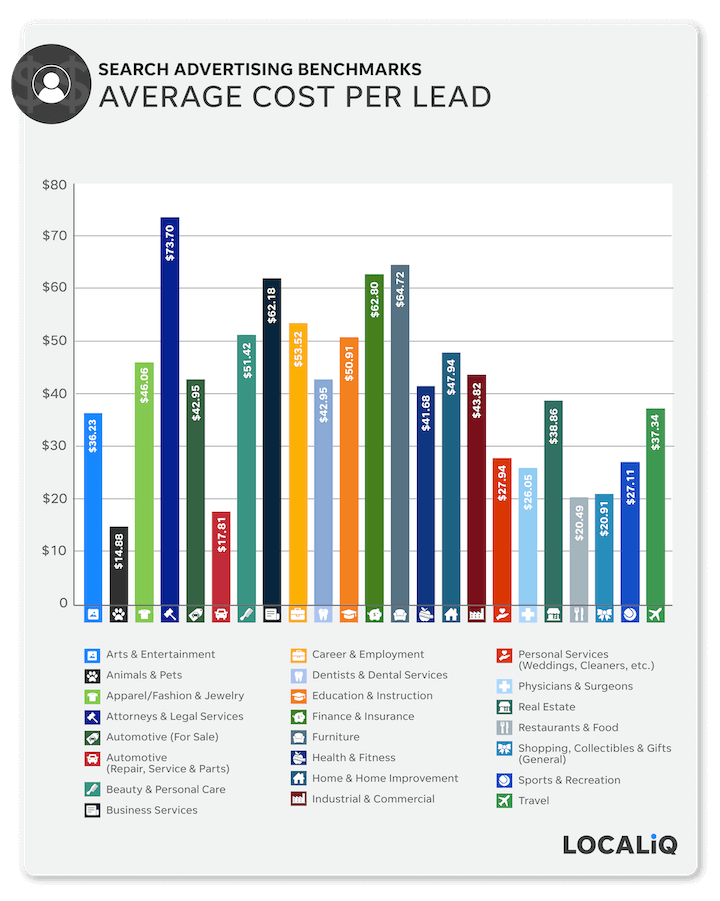
Average cost per lead for search advertising
| Business Category | Average Cost Per Lead |
| Arts & Entertainment | $36.23 |
| Animals & Pets | $14.88 |
| Apparel / Fashion & Jewelry | $46.06 |
| Attorneys & Legal Services | $73.70 |
| Automotive — For Sale | $42.95 |
| Automotive — Repair, Service & Parts | $17.81 |
| Beauty & Personal Care | $51.42 |
| Business Services | $62.18 |
| Career & Employment | $53.52 |
| Dentists & Dental Services | $42.95 |
| Education & Instruction | $50.91 |
| Finance & Insurance | $62.80 |
| Furniture | $64.72 |
| Health & Fitness | $41.68 |
| Home & Home Improvement | $47.94 |
| Industrial & Commercial | $43.82 |
| Personal Services | $27.94 |
| Physicians & Surgeons | $26.05 |
| Real Estate | $38.86 |
| Restaurants & Food | $20.49 |
| Shopping, Collectibles & Gifts | $20.91 |
| Sports & Recreation | $27.11 |
| Travel | $37.34 |
Cost per lead, also known as cost per action, cost per conversion, or cost per acquisition, tells you how much you spent in order to get someone to complete a desired action—whether to fill out a form, call you, or make a purchase.
- We found the average cost per lead across all industries to be $41.40, ranging from $14.88 to $73.70.
- Industries with the highest cost per lead include attorneys and legal services ($73.70), furniture ($64.72), and finance and insurance ($62.80).
- Industries with the lowest cost per lead are animals and pets ($14.88), automotive repair, service, and parts ($17.81), and restaurants ($20.49).
This overall average is lower than what we’ve seen in the past, which is good news for advertisers. The automotive vertical has consistently been in the lowest bracket in our past findings.
Seeking a lower cost per lead?
Follow the tips in the following resources to improve your CPL:
- How to lower your CPL in Google Ads
- 5 Ways to Lower your PPC Cost Per Lead
- 5 More Ways to Lower your Cost Per Lead in PPC
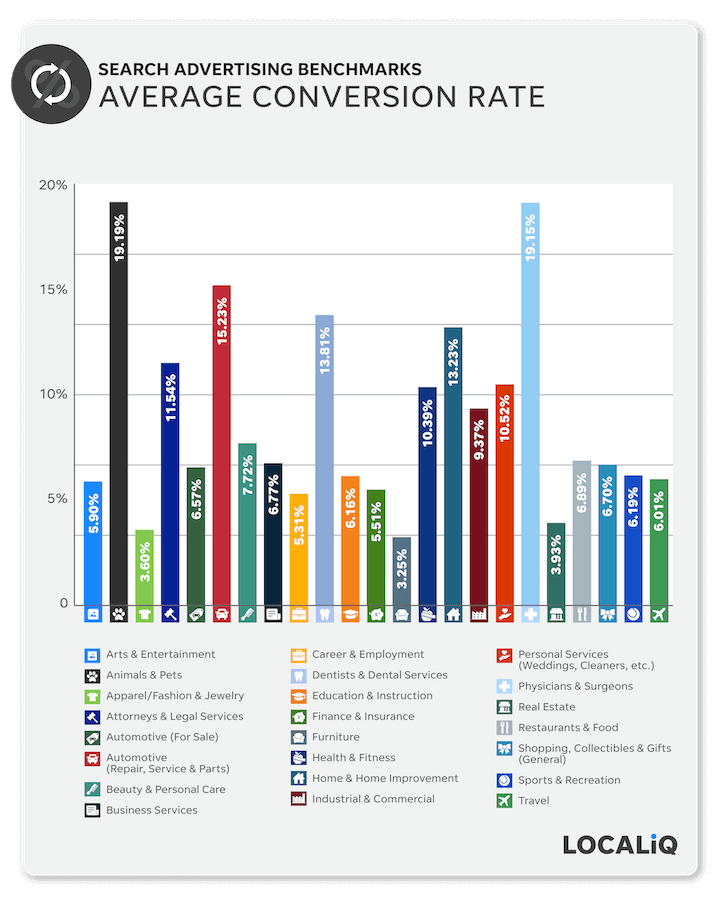
Average conversion rate for search advertising
| Business Category | Average Conversion Rate |
| Arts & Entertainment | 5.90% |
| Animals & Pets | 19.19% |
| Apparel / Fashion & Jewelry | 3.60% |
| Attorneys & Legal Services | 11.54% |
| Automotive — For Sale | 6.57% |
| Automotive — Repair, Service & Parts | 15.23% |
| Beauty & Personal Care | 7.72% |
| Business Services | 6.77% |
| Career & Employment | 5.31% |
| Dentists & Dental Services | 13.81% |
| Education & Instruction | 6.16% |
| Finance & Insurance | 5.51% |
| Furniture | 3.25% |
| Health & Fitness | 10.39% |
| Home & Home Improvement | 13.23% |
| Industrial & Commercial | 9.37% |
| Personal Services | 10.52% |
| Physicians & Surgeons | 19.15% |
| Real Estate | 3.93% |
| Restaurants & Food | 6.89% |
| Shopping, Collectibles & Gifts | 6.70% |
| Sports & Recreation | 6.19% |
| Travel | 6.01% |
While cost per lead measures how much you spent to get someone who clicked on your ad to contact you in some way, conversion rate tells you just how many people who clicked on your ad actually converted.
- We found the average conversion rate average across all industries to be 8.82%, ranging from 3.25% to 19.19%.
- Industries with the highest conversion rates include animals and pets (19.19%), physicians and surgeons (19.15%), and automotive repair, service, and parts (15.23%).
- Industries with the lowest conversion rates were furniture (3.25%), apparel/fashion and jewelry (3.6%), and real estate (3.93%).
Our past data also finds the highest conversion rates in the legal and automotive verticals and the lowest in real estate and apparel. On the other hand, the personals conversion rate has historically been higher than what we’re seeing here.
Ready to catapult your conversion rates?
- Try out these 5 Strategies to Improve PPC Lead Quality
- Understand the ins and outs of conversion rate optimization (CRO)
- Learn 6 Overlooked Optimizations to Increase Your PPC Conversion Rates
Want more advertising benchmarks?
You can get the full report on these search advertising benchmarks, plus expert insights and tips to improve your results, in LOCALiQ’s full search ad benchmarks report. You may also be interested in these vertical-specific advertising benchmarks:
- 2021 real estate advertising benchmarks
- 2021 home services advertising benchmarks
- 2021 healthcare advertising benchmarks
Data source
This report is based on a sample of 18,316 North American-based LOCALiQ client campaigns in the outlined business categories that were running search advertising across all search engines between May 1, 2020, and June 25, 2021. Each business category includes a minimum of 69 unique active client campaigns. “Averages” are technically median figures to account for outliers. All currency values are posted in USD.

Meet The Author
Kristen McCormick
Kristen is the Head of Marketing at Hatch, a customer communication platform for service-based businesses. She was previously the Senior Managing Editor at WordStream. Her cat Arnold has double paws on every paw, and she finds life to be exponentially more delightful on a bicycle.
Recommended for you