Running real estate ads in 2021 and wondering what your results should look like? It can be difficult to tell whether or not your campaigns are hitting the mark—or missing them entirely.
One way to be sure your real estate advertising is on track is to look at available industry benchmarks to determine the answers to questions like:
- What’s a good conversion rate for real estate advertising?
- What’s the average click-through rate for real estate ads?
- What’s a good cost per lead for real estate advertising?
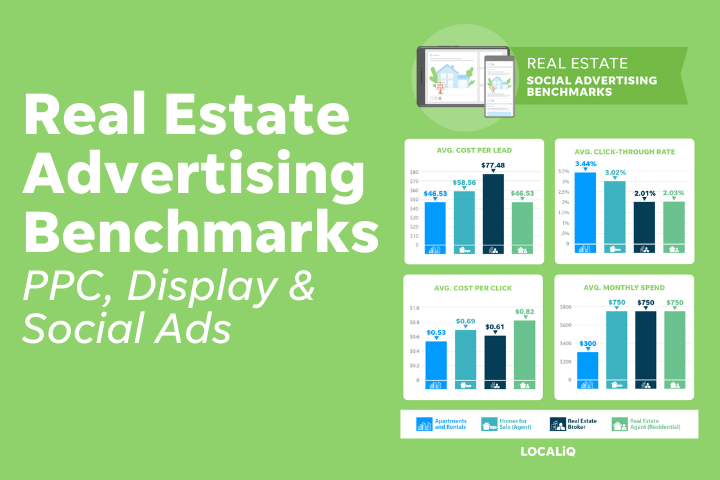
To provide some context around your real estate advertising results, WordStream and LOCALiQ have partnered to share some benchmarks based on new data for the real estate industry.
Here, we’re providing the following metrics for search, display, and social ads across four key real estate vertical subcategories:
- Average click-through rate
- Average cost per lead
- Average conversion rate
- Average monthly budget
Real estate advertising benchmarks for search ads
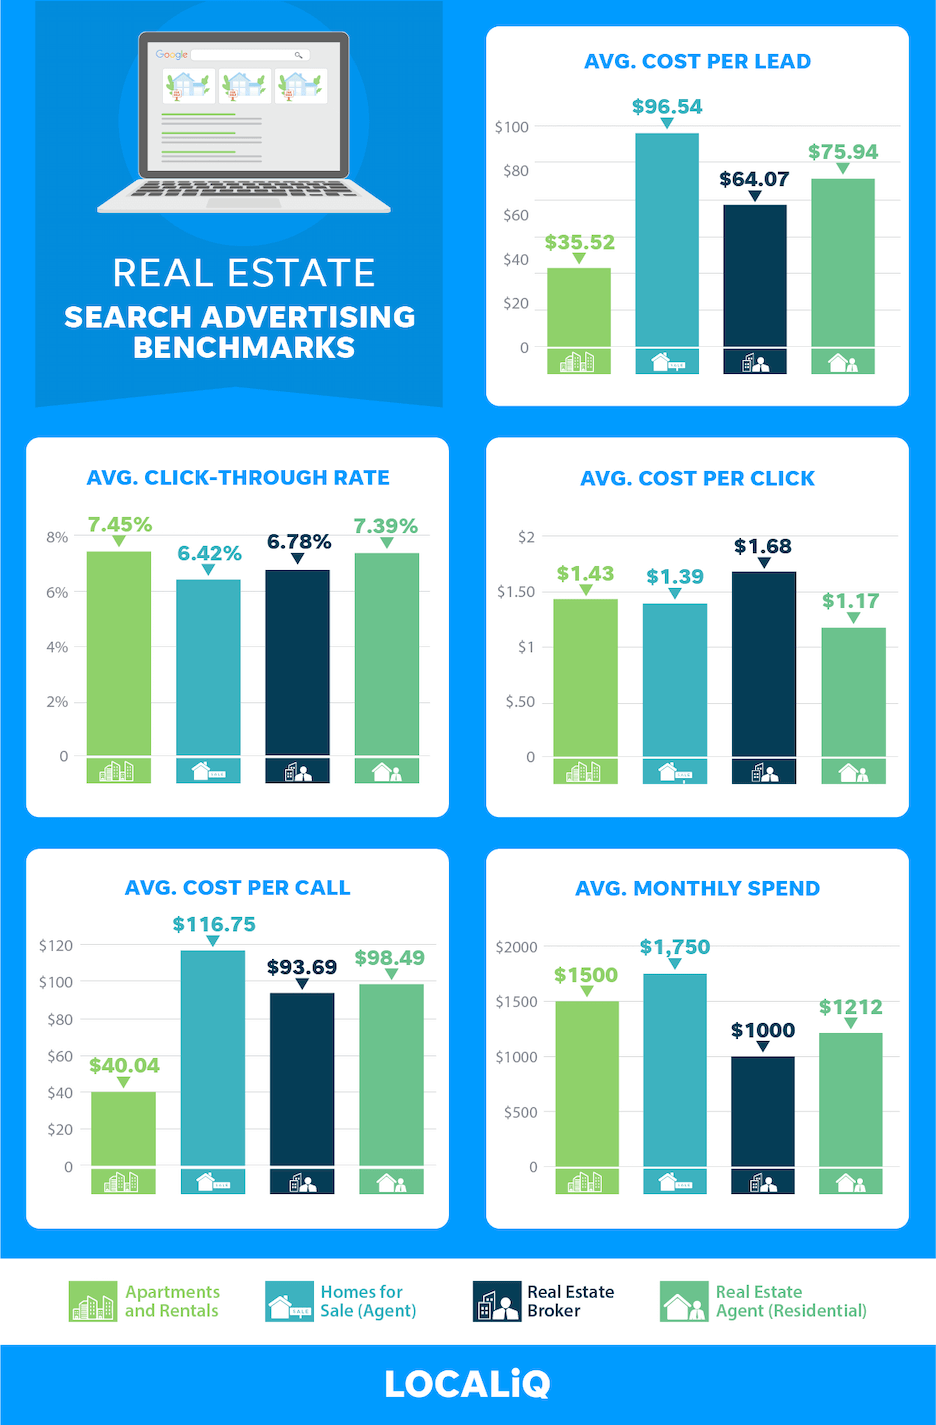
| Subcategory | Average Cost Per Lead | Average Click-Through Rate | Average Cost Per Click | Average Cost Per Call | Average Monthly Spend |
|---|---|---|---|---|---|
| Apartments & Rentals | $35.52 | 7.45% | $1.43 | $40.04 | $1,500 |
| Homes for Sale (Agent) | $96.54 | 6.42% | $1.39 | $116.75 | $1,750 |
| Real Estate Broker | $64.07 | 6.78% | $1.68 | $93.69 | $1,000 |
| Real Estate Agent | $75.94 | 7.39% | $1.17 | $98.49 | $1,212 |
With a high average click-through rate across all subcategories and a low average cost per lead, the data shows that paid search is a winning advertising strategy for the real estate industry.
Apartments and rentals see an exceptional average cost per lead at just $35.52. Even homes for sale by agent campaigns see a low cost per lead under $100, which can yield a high return on investment when you consider the average home cost is just over $293k with an average commission of 5-6% (amounting to a whopping $14,650-17,580 per home sale).
The average cost per click across all real estate subcategories is also promising at less than $1.70. To compare, the industry average cost per click for real estate is $2.37.
Where can you improve in your account? Find out with our free Google Ads Performance Grader.
Real estate advertising benchmarks for display advertising
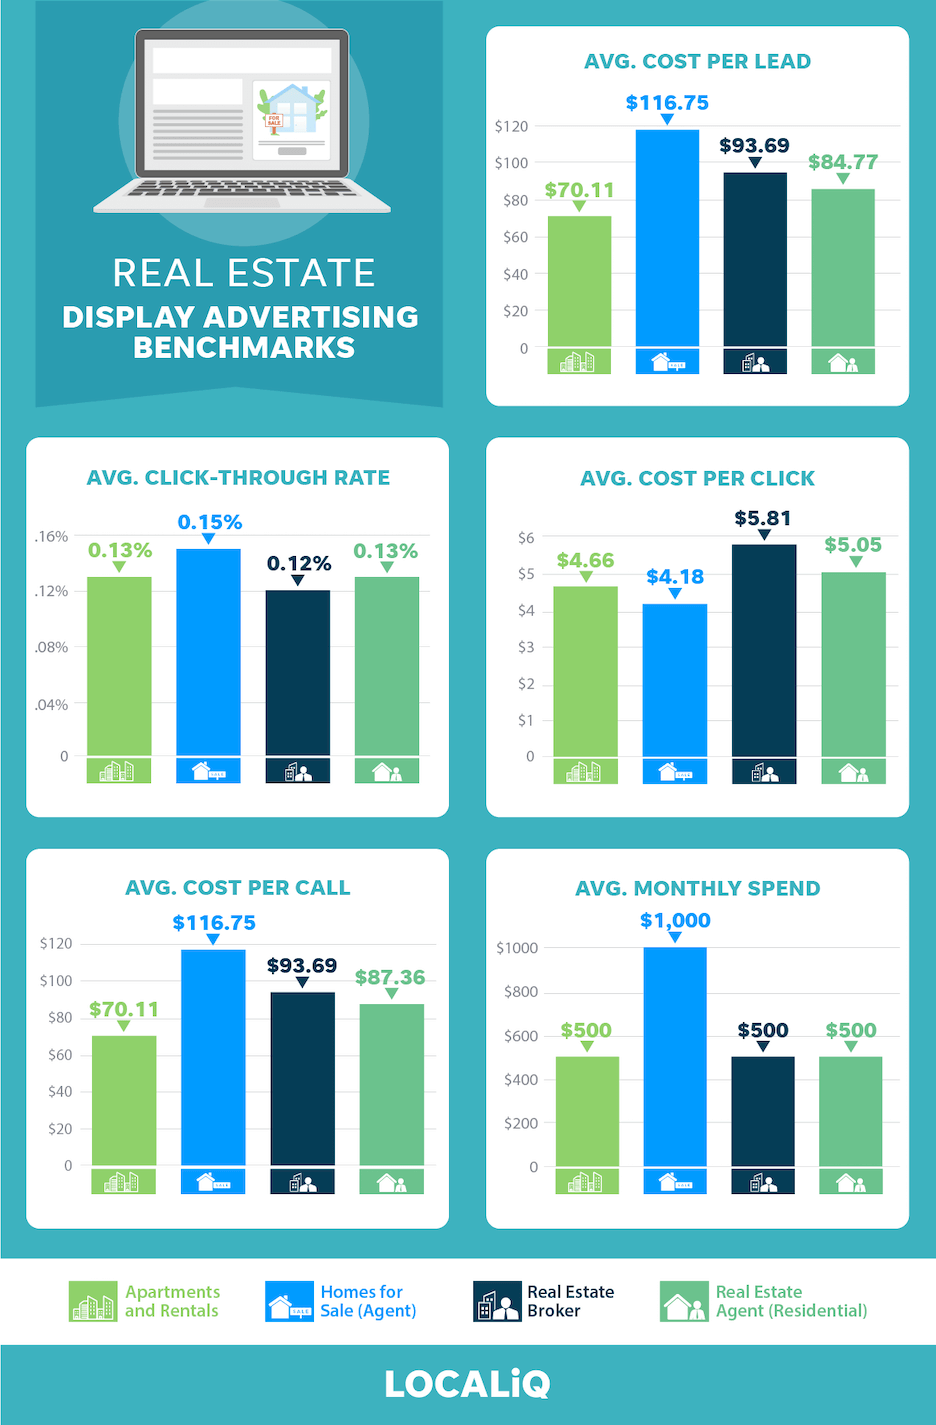
| Subcategory | Average Cost Per Lead | Average Click-Through Rate | Average Cost Per Click | Average Cost Per Call | Average Monthly Spend |
| Apartments & Rentals | $70.11 | 0.13% | $4.66 | $70.11 | $500 |
| Homes for Sale (Agent) | $116.75 | 0.15% | $4.18 | $116.75 | $1,000 |
| Real Estate Broker | $93.69 | 0.12% | $5.81 | $93.69 | $500 |
| Real Estate Agent | $84.77 | 0.13% | $5.05 | $87.36 | $500 |
Display advertising is a natural fit for real estate industry businesses looking to increase awareness with potential buyers or renters in their areas. Because display advertising is a top-of-funnel strategy focused on getting your business in front of people across the web and less about driving leads, it doesn’t typically have the highest conversion rates or click-through rates.
However, these display advertising benchmarks are still promising when you, again, look at the average value of a new lead for these subcategories.
While average cost per lead and average cost per click is higher for real estate display ads than for real estate search ads, one of the benefits of display advertising is that it can improve your search ad results. In fact, there’s a nearly 60% increase in conversions when a search is conducted for a business after seeing a display ad.
So while these display ads averages may not seem as impressive in comparison to the search ad benchmarks, display advertising is still a worthwhile and effective real estate advertising strategy.
>> Get a full tutorial on how to run Google Ads for real estate here!
Real estate advertising benchmarks for social media advertising
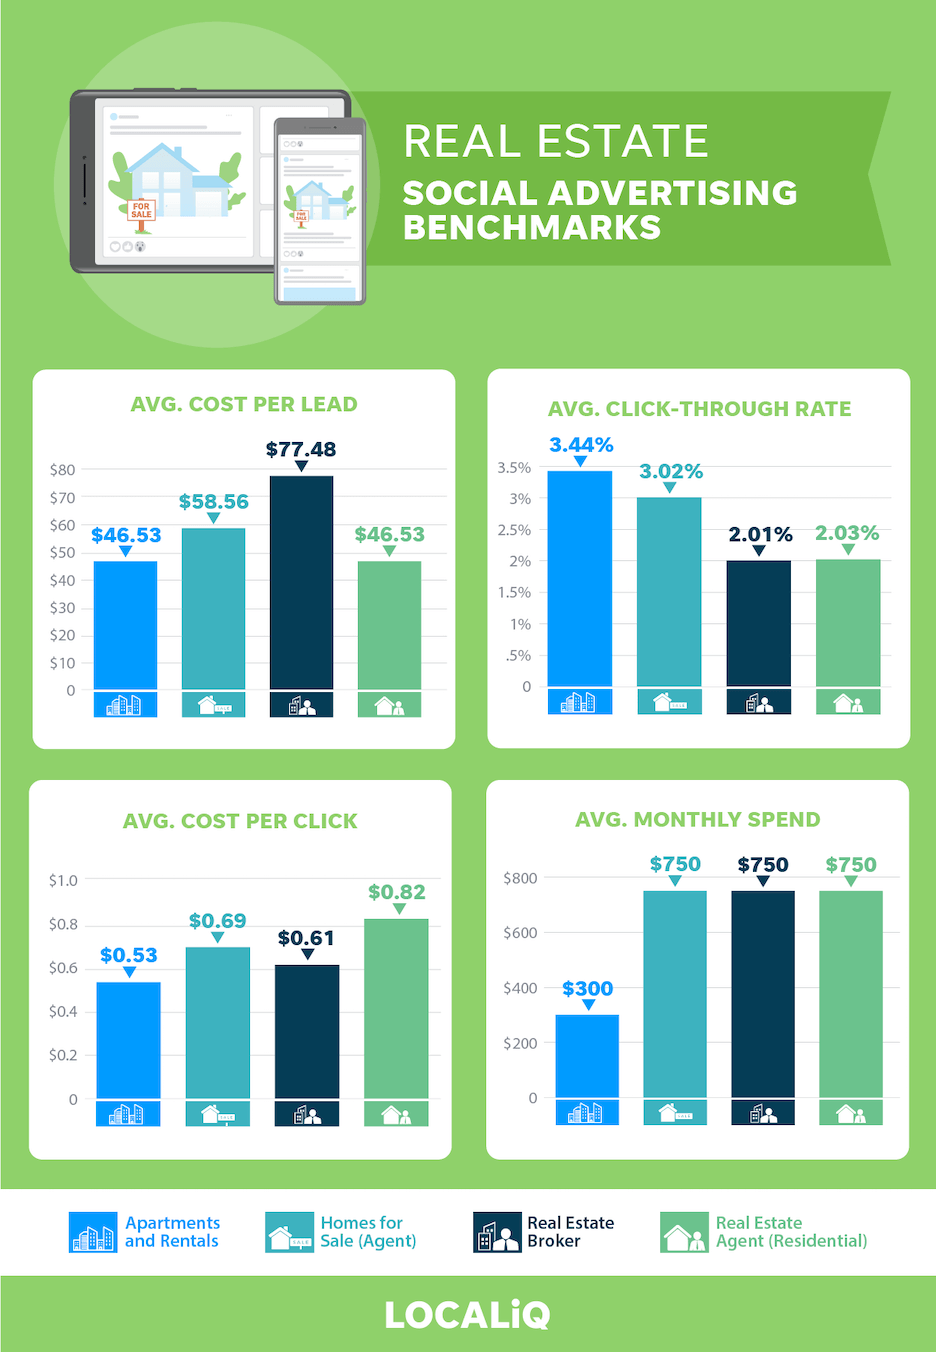
| Subcategory | Average Cost Per Lead | Average Click-Through Rate | Average Cost Per Click | Average Cost Per Call | Average Monthly Spend |
| Apartments & Rentals | $46.53 | 3.44% | $0.53 | $70.11 | $300 |
| Homes for Sale (Agent) | $58.56 | 3.02% | $0.69 | $116.75 | $750 |
| Real Estate Broker | $77.48 | 2.01% | $0.61 | $116.75 | $750 |
| Real Estate Agent | $46.53 | 2.03% | $0.82 | $116.75 | $750 |
Social media advertising on Facebook, Instagram, LinkedIn, and YouTube is a highly effective strategy for real estate. Just ask the 77% of real estate agents who use social media as part of their marketing—or the almost 50% that say social media results in their highest quality leads.
The data shows that our clients are getting excellent results with social media advertising with a high average click-through rate between 2.01% to 3.02%. To compare, the available data on average social ads click-through rate for real estate is 0.99%.
These real estate businesses are also seeing a low average cost per lead. Apartments and rentals and residential real estate agents each have an average cost per lead under $50, while homes for sale by agent have an average cost per lead under $60, and real estate brokers have an average cost per lead under $80.
To find out how you can optimize your Facebook ads, use our free Facebook Ads Performance Grader.
Improve your real estate advertising results
By understanding the data around real estate advertising benchmarks, you can compare your results to see how you’re performing and determine whether or not you need to make optimizations to your campaigns across search, display, and social. Get even more insights into these real estate advertising benchmarks plus actionable ideas on how to improve your real estate advertising from LOCALiQ.
You may also be interested in:
- 2021 search advertising benchmarks for every industry
- 2021 home services advertising benchmarks
- 2021 healthcare advertising benchmarks
Data sources
This data was pulled from a sample of 2,690 North American-based LOCALiQ client accounts in the real estate vertical who were running search advertising, display advertising, and/or social media advertising between March 1, 2020, and April 25, 2021. Each subcategory includes at minimum 10 unique active clients. “Averages” are technically median figures to account for outliers. All currency values are posted in USD.



![Search Advertising Benchmarks for Your Industry [Report]](https://www.wordstream.com/wp-content/uploads/2024/04/RecRead-Guide-Google-Benchmarks.webp)


