Let’s say you’re running ads for your healthcare business. You can identify your top-performing campaigns in relation to your other campaigns or time periods, but what about in relation to other businesses in your vertical?
Or let’s say you’re a healthcare business considering running ads. How much can you expect to pay, and for what kinds of results? Understanding industry averages is crucial for ensuring you are, or will be getting, the most out of your advertising budget.
That’s why we’ve partnered with LocaliQ to provide the very healthcare advertising benchmarks you’re looking for! With this data, you can understand your full ROI potential and set the right goals to reach it. So let’s dive in.
About these healthcare benchmarks
This benchmark data report covers the following metrics for search, display, and social advertising across 11 healthcare subcategories:
- Average click-through rate (CTR)
- Average cost per lead (CPL)
- Average cost per click (CPC)
- Average conversion rate
- Average monthly spend
You can also compare them to our previous healthcare marketing insights!
Search ads
Looking for 2023 data? Get updated healthcare search advertising benchmarks here.
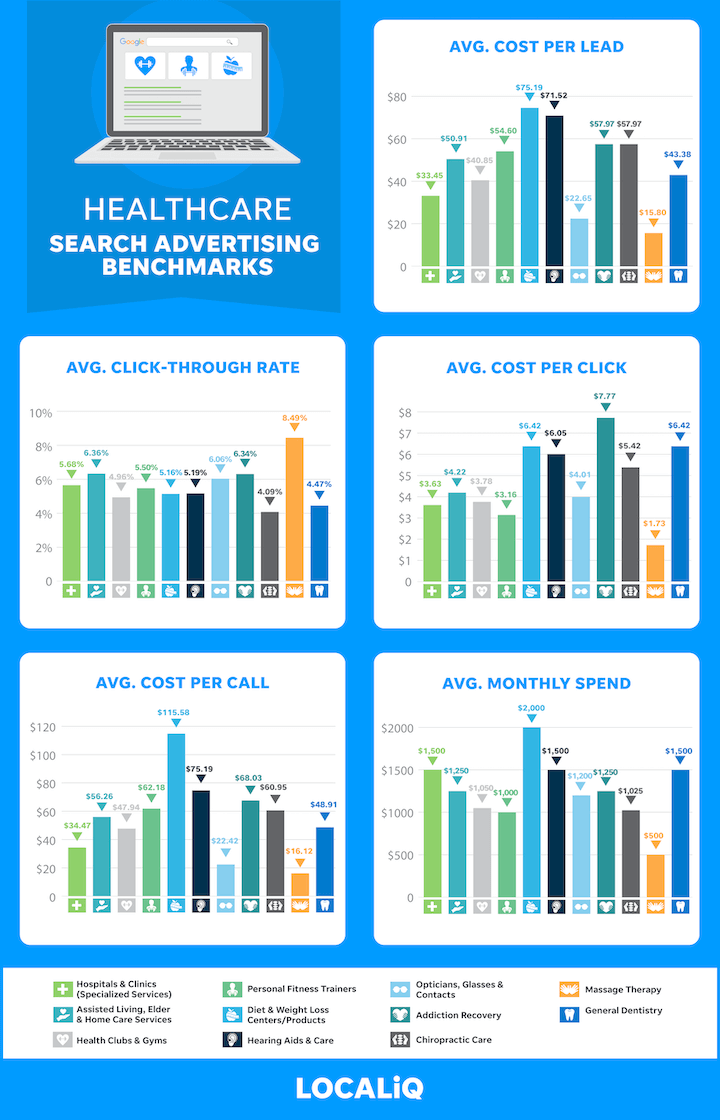
| Subcategory | Average Cost Per Lead | Average Click-Through Rate | Average Cost Per Click | Average Cost Per Call | Average Monthly Spend |
| Hospitals & Clinics | $33.45 | 5.68% | $3.63 | $34.47 | $1,500 |
| Assisted Living, Elder & Home Care Services | $50.91 | 6.36% | $4.22 | $56.26 | $1,250 |
| Health Clubs & Gyms | $40.85 | 4.96% | $3.78 | $47.94 | $1,050 |
| Personal Fitness & Trainers | $54.90 | 5.50% | $3.16 | $62.18 | $1,000 |
| Diet & Weight Loss Centers/ Products | $75.19 | 5.16% | $6.42 | $115.58 | $2,000 |
| Hearing Aids & Care | $71.52 | 5.19% | $6.05 | $75.19 | $1,500 |
| Opticians, Glasses & Contacts | $22.65 | 6.06% | $4.01 | $22.42 | $1,200 |
| Addiction Recovery | $57.97 | 6.34% | $7.77 | $68.03 | $1,250 |
| Chiropractic Care | $57.97 | 4.09% | $5.42 | $60.95 | $1,025 |
| Massage Therapy | $15.80 | 8.49% | $1.73 | $16.12 | $500 |
| General Dentistry | $43.38 | 4.47% | $6.42 | $48.91 | $1,500 |
We know that consumer intent is highest when on search, but did you know that in the healthcare industry, a whopping 88% of consumers transition directly from online search to phone call? Given the exceptionally high conversion rates from phone calls in this vertical, businesses are wise to establish prominence in search results through healthcare search advertising. And according to these benchmarks, the investment is well worth it.
For search ads across all healthcare subcategories, we found:
- An overall average cost per lead of $47.69, ranging from $15.80 (massage therapy) to $75.19 (diet and weight loss).
- An overall average click-through rate of 5.66%, ranging from 4.09% (chiropractic care) to 8.49% (massage therapy).
- An overall average cost per click of $4.78, ranging from $1.73 (massage therapy) to $7.77 (addiction recovery).
- An overall average cost per call of $55.28, ranging from $16.12 (massage therapy) to $115.58 (diet and weight loss).
When you consider average prices for routine visits from these subcategories, these average costs per lead and per call promise a high ROI. For example, the average price for a routine dental visit is $127, so paying under $50 for a call or lead is highly profitable.
Head here to see search advertising benchmarks across all industries for 2021.
Display ads
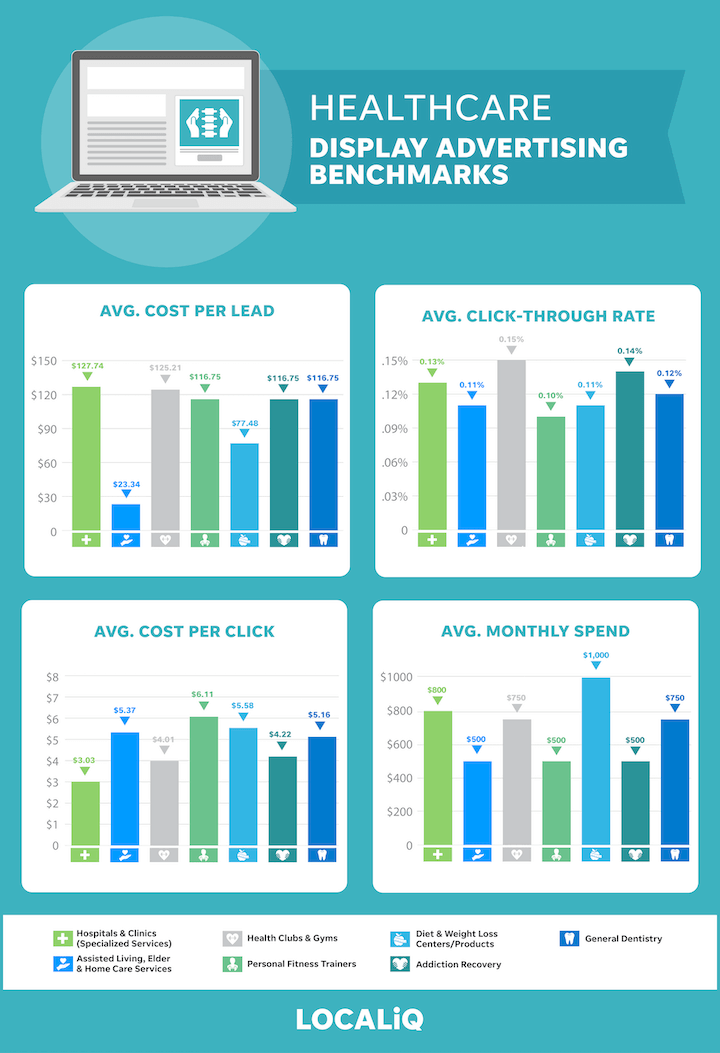
| Subcategory | Average Cost Per Lead | Average Click-Through Rate | Average Cost Per Click | Average Monthly Spend |
| Hospitals & Clinics | $127.74 | 0.13% | $3.03 | $800 |
| Assisted Living, Elder & Home Care Services | $23.34 | 0.11% | $5.37 | $500 |
| Health Clubs & Gyms | $125.21 | 0.15% | $4.01 | $750 |
| Personal Fitness Trainers | $116.75 | 0.10% | $6.11 | $500 |
| Diet & Weight Loss Centers/ Products | $77.48 | 0.11% | $5.58 | $1,000 |
| Addiction Recovery | $116.75 | 0.14% | $4.22 | $500 |
| General Dentistry | $116.75 | 0.12% | $5.16 | $750 |
Unlike search ads, display ads are visual assets that allow you to stand out from competitors and create a more memorable impression. And when targeted at people who have already visited your site (retargeting display ads), or who are browsing sites like yours (contextual display), you can be sure you’re building brand awareness with the right people.
For display ads across all healthcare subcategories, we found:
- An overall average cost per lead of $100.57, ranging from $23.34 (assisted living, elder, and home care) to $127.74 (hospitals and clinics). As you can see, the cost per lead for the assisted living category is a bit of an outlier, bringing down the overall average.
- An overall average click-through rate of 0.12%, ranging from 0.10% (diet and weight loss) to 0.15% (health clubs and gyms).
- An overall average cost per click of $4.78, ranging from $3.03 (chiropractic care) to $6.11 (diet and weight loss).
These click-through rates pale in comparison to those of search ads, but statistics show that brand awareness leads more customers to convert on all your other marketing efforts—especially your search ads (learn four ways to identify the impact of your display ads on search ads here). So as a “power-up” to all of your strategies that also happens to generate its own clicks and conversions, display ads are a wise investment.
Where can you improve in your account? Find out with our free Google Ads Performance Grader.
Social ads
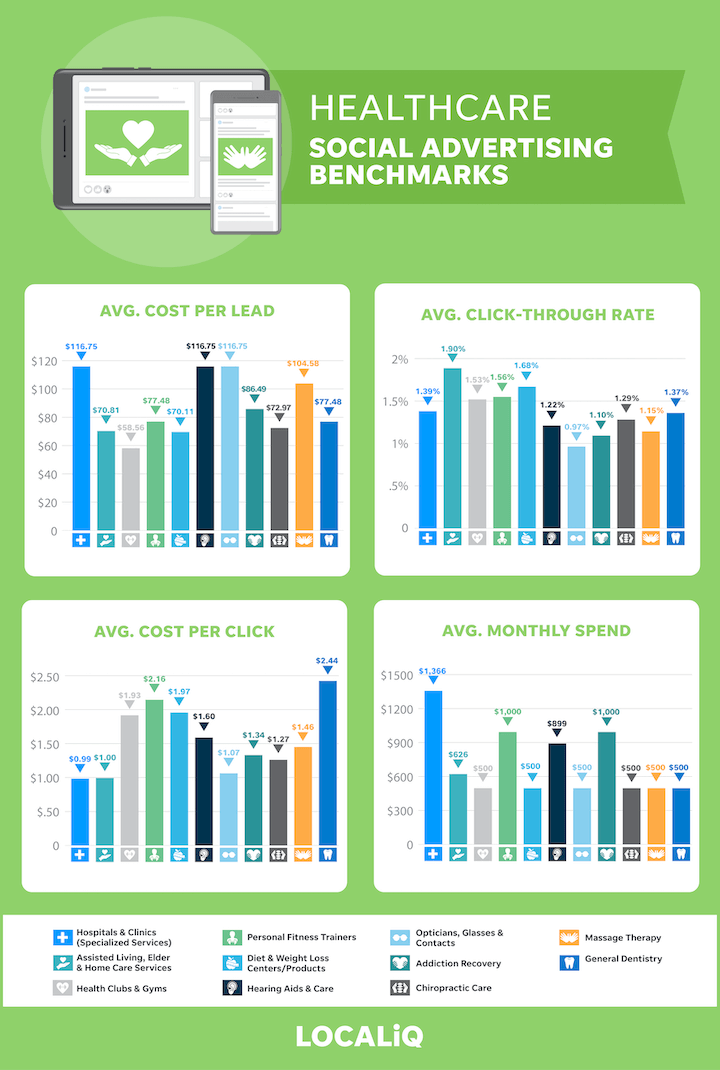
| Subcategory | Average Cost Per Lead | Average Click-Through Rate | Average Cost Per Click | Average Monthly Spend |
| Hospitals & Clinics | $116.75 | 1.39% | $0.99 | $1,366 |
| Assisted Living, Elder & Home Care Services | $70.81 | 1.90% | $1.00 | $626 |
| Health Clubs & Gyms | $58.56 | 1.53% | $1.93 | $500 |
| Personal Fitness Trainers | $77.48 | 1.56% | $2.16 | $1,000 |
| Diet & Weight Loss Centers/ Products | $70.11 | 1.68% | $1.97 | $500 |
| Hearing Aids & Care | $116.75 | 1.22% | $1.60 | $899 |
| Opticians, Glasses & Contacts | $116.75 | 0.97% | $1.07 | $500 |
| Addiction Recovery | $86.49 | 1.10% | $1.34 | $1,000 |
| Chiropractic Care | $72.97 | 1.29% | $1.27 | $500 |
| Massage Therapy | $104.58 | 1.15% | $1.46 | $500 |
| General Dentistry | $77.48 | 1.37% | $2.44 | $500 |
Social media advertising is especially helpful for healthcare businesses since the detailed targeting allows you to segment and hyper-personalize your campaigns—such as by age and interests. Furthermore, healthcare has historically shown higher conversion rates than other verticals on social media.
For social ads across all healthcare subcategories, we found:
- An average cost per lead of $88.07, ranging from $58.56 (health clubs and gyms) to $116.7 (for hospitals and clinics, hearing aids and care, and opticians, glasses, and contacts).
- An average click-through rate of 1.38%, ranging from 0.97% (opticians, glasses, and contacts) to 1.90% (assisted living, elder, and home care).
- An average cost per click of $1.57, ranging from $0.99 (hospitals and clinics) to $2.44 (general denistry).
Social media ads for healthcare businesses have the lowest cost per click averages compared to search and display. Click-through rates are about 10x higher than display, but still four times lower than those of search ads.
To find out how you can optimize your Facebook ads, use our free Facebook Ads Performance Grader.
Reach your highest ROI potential with these healthcare advertising benchmarks
Now you can see exactly what a good search ad click-through rate looks like for your massage business, or a solid cost per lead on Facebook for your addiction recovery service. And you can identify what areas of your strategy need improvement and which ones should be harnessed and scaled. For the full report, including tips to improve your performance on each channel, head to LOCALiQ’s 2021 Healthcare Advertising Benchmarks Report.
For additional benchmark data, you may be interested in:
- Home services advertising benchmarks
- Real estate advertising benchmarks
- Paid search ad benchmarks for every industry
Data sources
This report is based on a sample of 2,838 North American-based LOCALiQ client campaigns in the healthcare vertical across search advertising, display advertising, and/or social media advertising between May 1, 2020, and June 25, 2021. Each subcategory includes at minimum 10 unique active clients. “Averages” are technically median figures to account for outliers. All currency values are posted in USD.


![Search Advertising Benchmarks for Your Industry [Report]](https://www.wordstream.com/wp-content/uploads/2024/04/RecRead-Guide-Google-Benchmarks.webp)


