Search advertising is one of the best and most effective ways to reach your potential customers, right when they’re looking to buy. But it can also be one of the most frustrating and confusing of digital marketing tactics. Many businesses trying to run search ads on Google struggle to achieve ROI. Some give up completely. But it doesn’t have to be this way!
That’s why we set out to discover the secrets behind high-performing Google Ads accounts. We analyzed over 250,000 reports, representing more than 15,000 individual accounts, each a business or agency who made use of our free Google Ads Grader tool last year.
We found some surprising results, and not all of them were pretty. But one great discovery is that plenty of small and medium-sized businesses with moderate budgets are making paid search work! Keep reading for a deep dive into all the data, our favorite insights, and our very best tips to up your Google Ads game.
Contents
- Most Google Ads accounts are wasting over $1,000 a month
- 1 in 4 accounts have zero conversions in a month
- The top performers in Google Ads are NOT the biggest spenders!
- A high Quality Score is harder to achieve than you think
- Accounts with at least one negative keyword saw 3X higher conversion rates
- More impressions doesn’t equal more conversions
- Most top-performing accounts have a similar structure
- Google Ads fast stats and facts
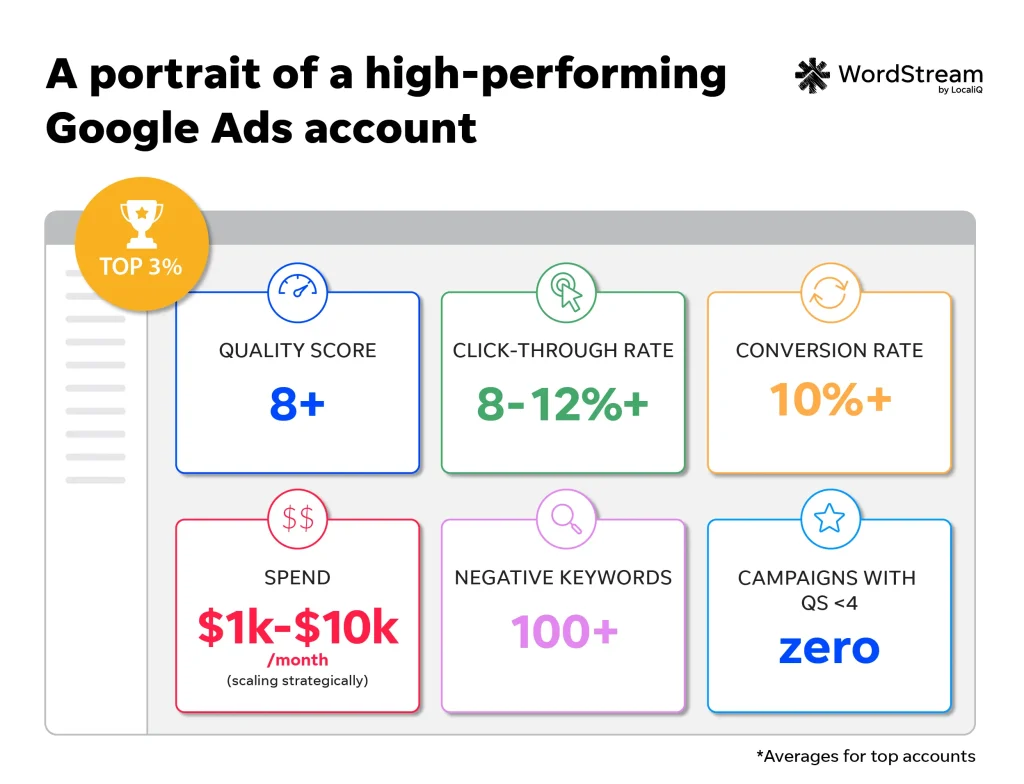
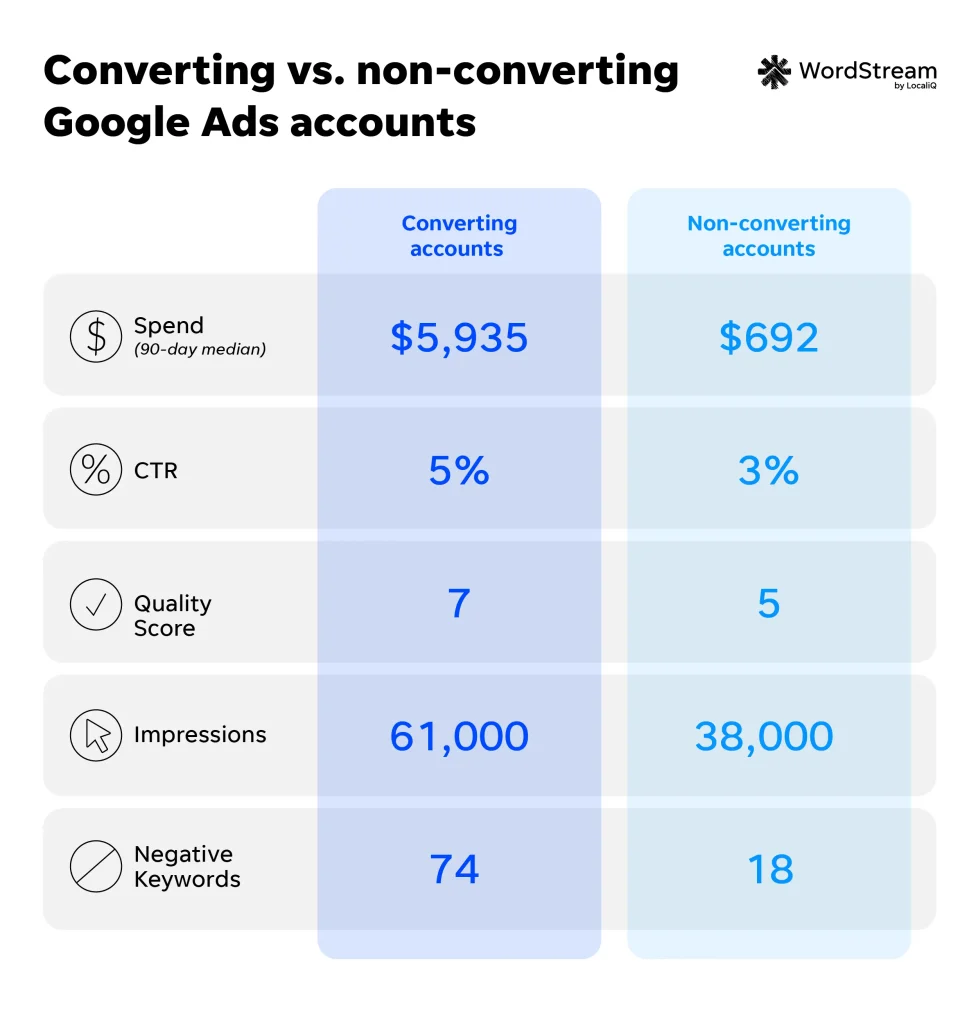
Before we dig into the findings, here’s a look at what a top 3% all-star Google Ads account looks like:
7 surprising findings from our study of over 15,000 Google Ads accounts
Here are seven shockers that jumped out at us after analyzing over 250,000 Google Ads Grader reports run by businesses in over 23 industries.
🚨Ready to see how your business’s Google Ads account stacks up against the competition? Get a free, instant account report using our Google Ads Grader!
1. Most Google Ads accounts are wasting over $1,000 a month
No advertiser wants to waste spend, which, in Google Ads terms, means paying for clicks on ads that aren’t converting.
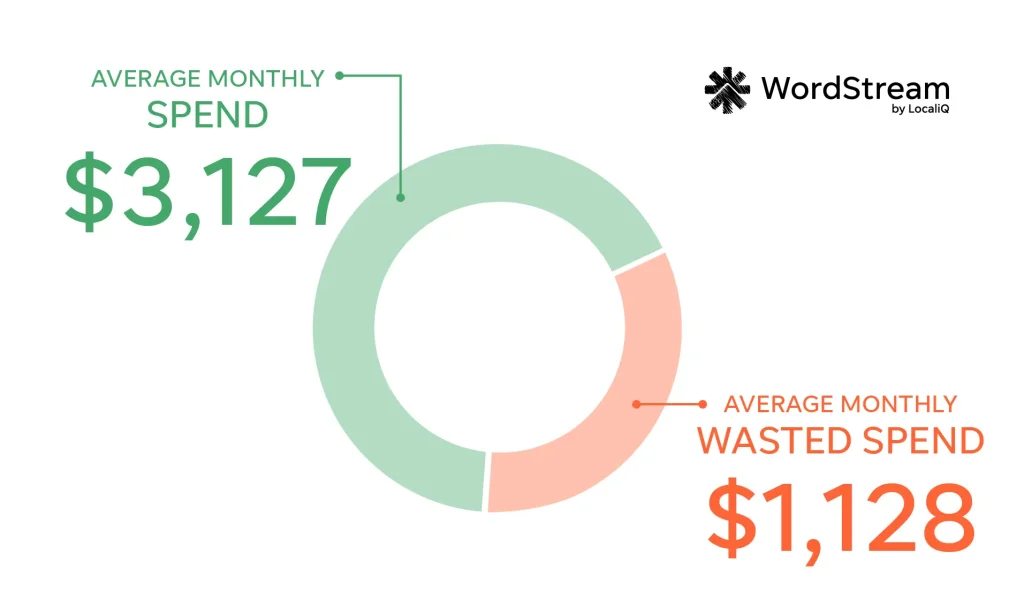
But we found that the average business wastes $1,127.54 in Google Ads per month.
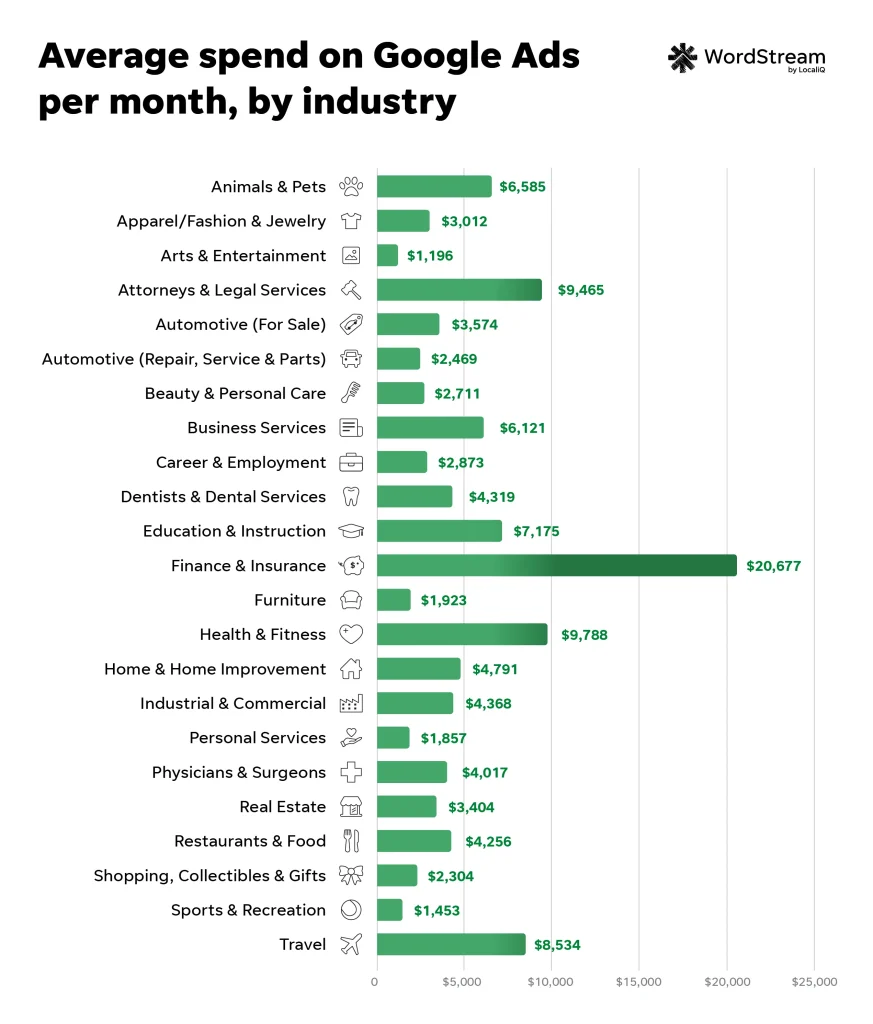
Based on our data, the average business spends over $3K on Google Ads per month, which means that some accounts are wasting nearly half of their total search advertising budget. Plus, we saw a couple of accounts that wasted over $10K a month!
Seeing some wasted spend is normal, because you’re not going to get a 100% conversion rate (we wish!). But you might see more wasted spend if you’re not keeping a close eye on reports like search terms or auction insights to ensure you’re only spending on clicks from high-intent SERPs.
To cut down on wasted spend, you can tighten your account structure, routinely add negative keywords, or check out this search ads optimization checklist.
You might also want to use a budget planning template and refer to cost benchmarks for your industry to see what your business will have to spend to get the results you want.
2. 1 in 4 accounts have zero conversions in a month
About 29% of accounts in the dataset recorded zero conversions over a 90-day period. That means their Google Ads campaigns potentially yielded no new contacts or customers. Yikes!
One of the more obvious reasons a Google Ads account may have no conversions is because conversion tracking isn’t set up, whether by accident or by choice. In which case, their campaigns may have driven conversions, but they’ll never know they came from Google Ads.
Assuming an account’s conversion tracking is squared away, there are a few other indicators an account might see little to no conversions. When compared to high-converting accounts, these non-converters were spending less on average and had added fewer (or no) negative keywords.
Some of these accounts drove significant impressions but still no conversions, which could also point to inefficient targeting and low relevance, meaning many advertisers are paying for visibility that doesn’t always connect back to customer growth.
3. The top performers in Google Ads are NOT the biggest spenders!
While you’d think that more money = better results, according to our data, it turns out that top performers are not always the biggest spenders in the Google Ads game.
Some of the accounts we evaluated with high budgets fell short in terms of click-through rates and Quality Score.
This discovery is encouraging because it proves that it’s not all about how much you can spend—you can make Google Ads work for your budget as long as you’re focusing on foundational best practices like a solid account structure and consistent optimizations.
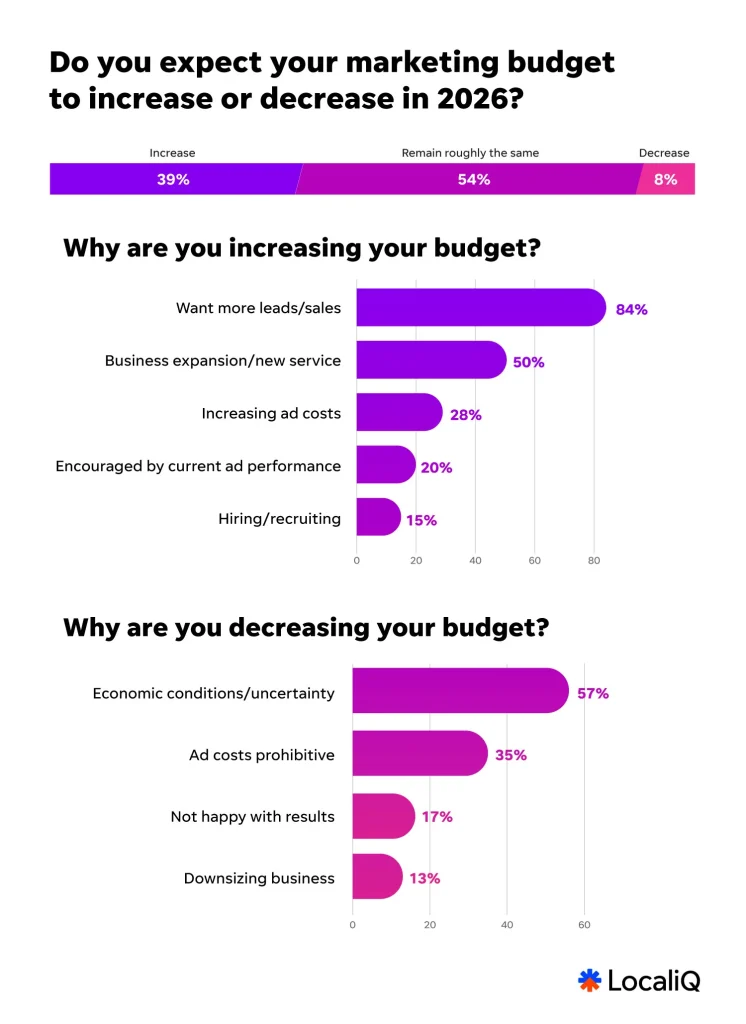
And while success doesn’t hinge on a higher budget, you may find you need to increase your Google Ads spend over time to see the results you want. Ad costs are rising across the board, and 28% of businesses are planning to increase their budgets to combat that.
4. A high Quality Score is harder to achieve than you think
Typically, a Quality Score above 7 is what we would call amazing for any account. Scores between 4-6 are pretty typical, and a 1-3 Quality Score indicates a need for improvement.
When looking at graded accounts over 90 days, the average Quality Score was between 5 and 6. This means that most accounts aren’t seeing those high Quality Scores.
Quality Score is a major contributing factor to Ad Rank and overall campaign health and performance, so if you tend to see more 4s, 5s, and 6s in your keyword reports, it’s worth trying to improve those scores.
However, some industries do tend to fare better in terms of Quality Score than others, so be mindful of what Quality Score might be most common in your business’s industry for a clearer comparison to your own account performance.
| Business category | Avg. Quality Score |
| Animals & Pets | 6.15 |
| Apparel / Fashion & Jewelry | 7.36 |
| Arts & Entertainment | 6.10 |
| Attorneys & Legal Services | 5.02 |
| Automotive — For Sale | 6.27 |
| Automotive — Repair, Service & Parts | 5.52 |
| Beauty & Personal Care | 6.01 |
| Business Services | 5.03 |
| Career & Employment | 5.90 |
| Dentists & Dental Services | 4.84 |
| Education & Instruction | 5.35 |
| Finance & Insurance | 5.72 |
| Furniture | 6.24 |
| Health & Fitness | 5.41 |
| Home & Home Improvement | 5.33 |
| Industrial & Commercial | 5.10 |
| Personal Services | 5.34 |
| Physicians & Surgeons | 4.95 |
| Real Estate | 5.69 |
| Restaurants & Food | 5.71 |
| Shopping, Collectibles & Gifts | 6.90 |
| Sports & Recreation | 6.75 |
| Travel | 6.59 |
Shopping, Collectibles, & Gifts and Apparel, Fashion, & Jewelry had the highest average Quality Scores in our data set, with both industries at about 7. This is followed by Sports & Recreation with a Quality Score of 6.75.
Meanwhile, Dentists & Dental Services (4.84), Physicians & Surgeons (4.95), and Attorneys & Legal Services (5.02) have the lowest average Quality Scores.
Remember, though, Quality Score doesn’t always tell the full story of your account. But knowing the average score in your industry can help you know what to shoot for when crafting your ad strategy.
5. Accounts with at least one negative keyword saw 3X higher conversion rates
Having at least one negative keyword can triple an account’s conversion rate.
Our data shows that accounts with at least one negative keyword have an average monthly conversion rate of 13%, while accounts with no negative keywords have an average conversion rate of 4.6%. That’s nearly a 3X improvement in conversion efficiency for accounts using negative keywords.
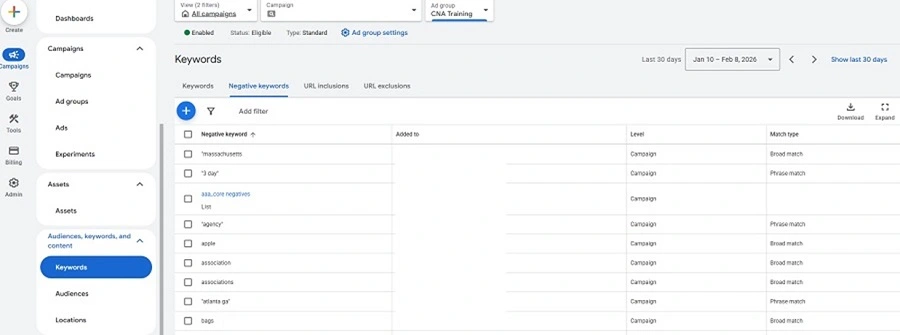
Give your negative keyword lists a checkup in the keywords section of the Google Ads platform under the negative keywords tab.
This data makes perfect sense because negative keywords keep your ads from showing for searches you’ve deemed irrelevant, which could increase impressions but limit conversions.
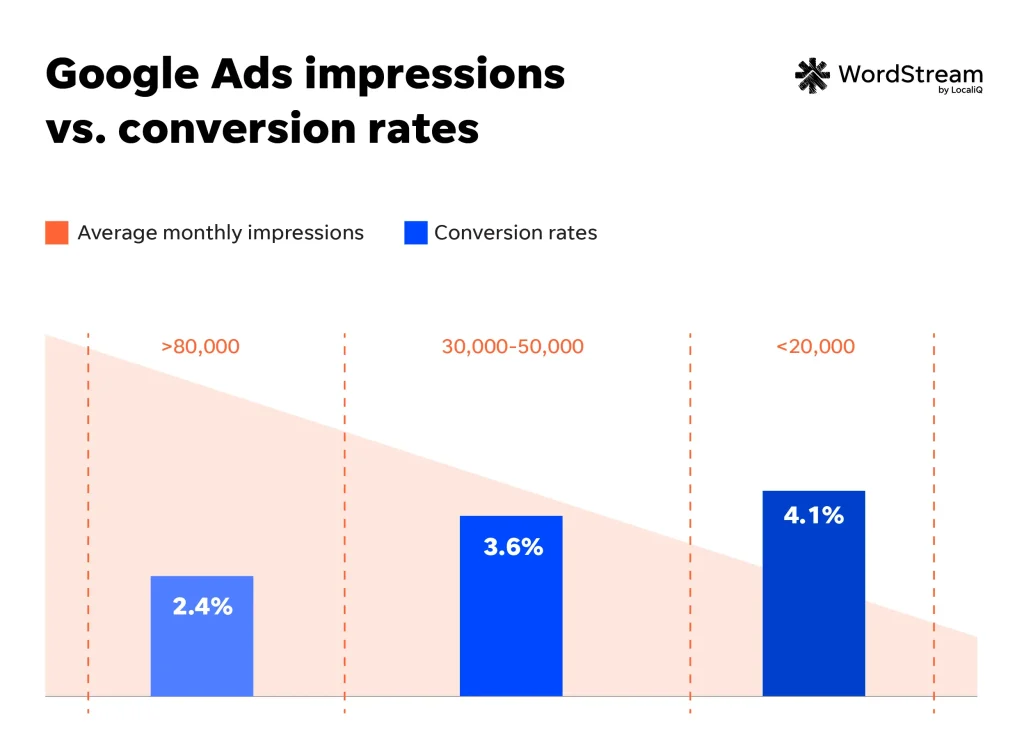
6. More impressions don’t equal more conversions
According to our data, a ton of impressions doesn’t necessarily lead to a ton of conversions. In fact, it’s really the opposite.
The data shows that accounts with the lowest range of impressions (fewer than 20K over a 90-day period) had the highest conversion rate of the bunch at 4.1%, while accounts with the highest range of impressions (+80K) had the lowest average conversion rate at 2.4%.
This likely speaks to targeting and intent. Accounts with fewer impressions could be sacrificing reach but getting in front of more qualified traffic, often through tighter targeting and more negative keywords.
It’s also important (to us) to point out that the accounts analyzed through our Google Ads Grader are still seeing lower average conversion rates than we found in our Google Ads benchmarks report of 7.52%. Those benchmarks are based on accounts run through our LocaliQ platform (not to toot our own horn or anything, but toot-toot).
7. Most top-performing accounts have a similar structure
High-performing accounts, based on factors like Quality Score and conversion rate, averaged roughly 2-3X more ad groups per account than low-performing accounts and ran more campaigns overall, indicating more granular structure and intent segmentation.
These high-performing accounts also used more campaigns that are separated by goals, locations, or services, along with significantly more ad groups to tightly align keywords, ads, and landing pages.
On the other hand, accounts with lower grades tended to rely on fewer, broader campaigns that lumped many keywords into large, unfocused ad groups.
This proves the importance of account structure, as more campaigns and ad groups usually equate to better intent segmentation, which improves ad relevance, click-through rates, and, in turn, Quality Score and Ad Rank.
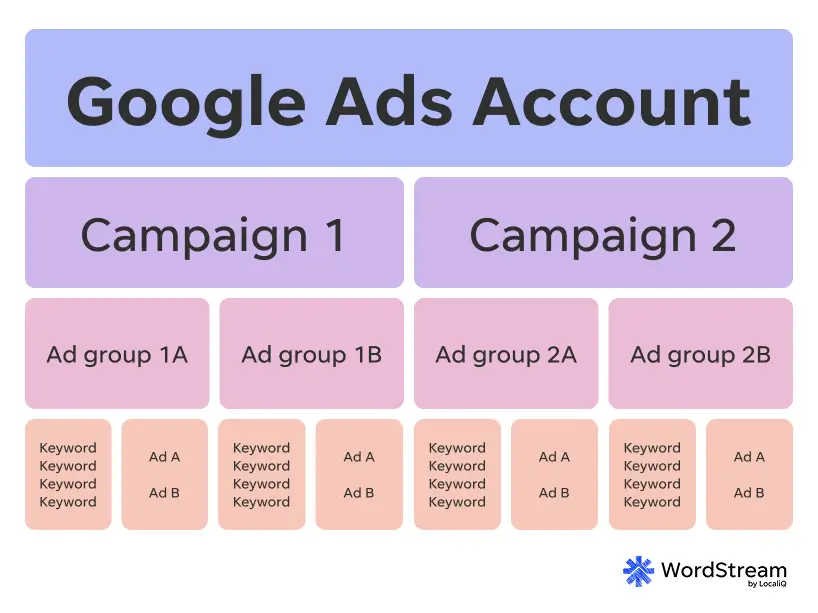
Most businesses with higher Google Ads account scores likely follow a structure like this for their paid search strategy.
🏠 Want to solidify your Google Ads account structure? Download our free guide to the perfect Google Ads account structure to take the guesswork out of your campaign, ad group, and keyword organization!
Google Ads account fast stats and facts
Here are the top stats we pulled from our analysis of 250,000 Google Ads accounts across 23 industries.
Google Ads spend stats
- The average Google Ads account spends about $3,127.38 per month.
- 24% of accounts spend under $1K/month, 39% spend between $1K–$10K/month, and 37% spend over $10K/month.
- The average Google Ads account wastes $1,127 per month, or $3,383 over 90 days.
Google Ads account performance stats
- Only 3% of advertisers achieve elite performance (QS 8+ AND 10%+ conversion rate).
- Small advertisers (<$1K) convert 32% better than $10K+ advertisers (18.8% vs 14.2%).
- Only 22% of accounts have a Quality Score of 7+.
- Just 12% of Google Ads accounts reach 8+, meaning top-tier account health is rare.
- 36% of accounts have a Quality Score below 4.
- 29% of Google Ads accounts record zero conversions over a 90-day period.
- Accounts with zero conversions still yielded an average of 12,667 impressions per month.
- Even among high spenders ($10K+), 4% generated zero conversions.
- The average CTR is 6.66%, but 28% have a CTR over 10%.
- 25% of businesses haven’t added a single negative keyword.
How to apply this Google Ads data to your account strategy
Hopefully, this exclusive data from our Google Ads Grader tool gives you a fresh perspective on account performance. There isn’t one specific metric that fully displays how your ads are doing, but the top performers are focusing on building a well-structured account and regularly applying controls on costs through tactics like negative keywords.
For more help applying these findings to your ad strategy, see how our solutions can maximize your campaigns no matter your goals or industry!
This report was co-authored by Elisa Gabbert and Stephanie Heitman. A big thanks to Paul Fontenot, Rob Glover, Heidi Hickman, and Becca Mann for their help gathering and analyzing the data.
About the data
This report is based on a sample of data from 251,236 reports run by 15,666 Google Ads accounts using WordStream’s Free Google Ads Performance Grader between January 1, 2025, and November 17, 2025. “Averages” are technically median figures to account for outliers. All currency values are posted in USD.
Ready for the next step?
- For beginners: Download our PPC 101 guide >>
- For active advertisers: Try our free Google Ads Performance Grader >>
- For the overwhelmed: Let us take PPC off your plate! Talk to one of our experts >>

Meet The Author
Susie Marino
Susie is the Senior Content Marketing Specialist for WordStream and LocaliQ, where she uses her experience as a PPC consultant to share tips, tactics, and best practices in the ever-evolving marketing and advertising space. Susie’s work has been featured in publications such as Search Engine Land, MediaPost, Social Media Today, and others. Outside of work, Susie loves to get outside for some snowboarding or (once the cold weather melts away) hiking!
Recommended for you