The marketing industry is constantly changing, and that’s particularly true of digital channels.
And while keeping up with new trends can be challenging, it’s more than worth the effort. Staying on top of what’s happening in the industry is the best way to keep up with your competitors and identify new strategies that will move you closer to your marketing goals.
With that in mind, we’ve compiled a list of 31 of the most important advertising statistics you should know to succeed in 2026.
Keep reading for the up-to-date information you need on PPC advertising, social media, mobile advertising, email marketing, video advertising, and what’s on the horizon for the marketing industry.
P.S. If you’re looking for more info, check out these 2026 digital marketing statistics!
PPC Advertising Statistics
1. Google and Facebook still hold the largest share of total US digital ad spend, with 38.6% and 19.9%, respectively.
It should come as no surprise to experienced digital marketers that the majority of online advertising dollars go to Google and Facebook.
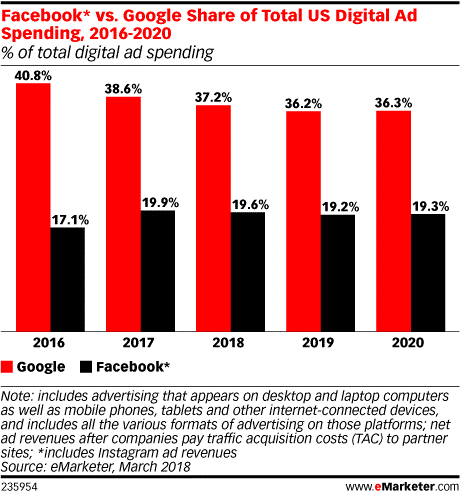
That said, both of their shares are expected to decrease slightly over the next few years as advertising options on other platforms like Amazon and Snapchat increase in popularity.
2. Businesses make an average of $2 in revenue for every $1 they spend on Google Ads.
If you’re unsure of whether Google Ads (formerly known as Google AdWords) has the potential to generate revenue for your business, you’ll be glad to hear that businesses typically make double their investment on the platform.
And if you’re already running Google Ads campaigns, but not seeing these kinds of results, this could be a sign that your strategy is in need of some adjustments.
3. The average click-through rate (CTR) in Google Ads across all industries is 3.17% for the search network and 0.46% on the display network.
Measuring your success on any advertising platform can be challenging without concrete benchmarks, which is why it can be helpful to know the average CTR of other marketers’ campaigns.
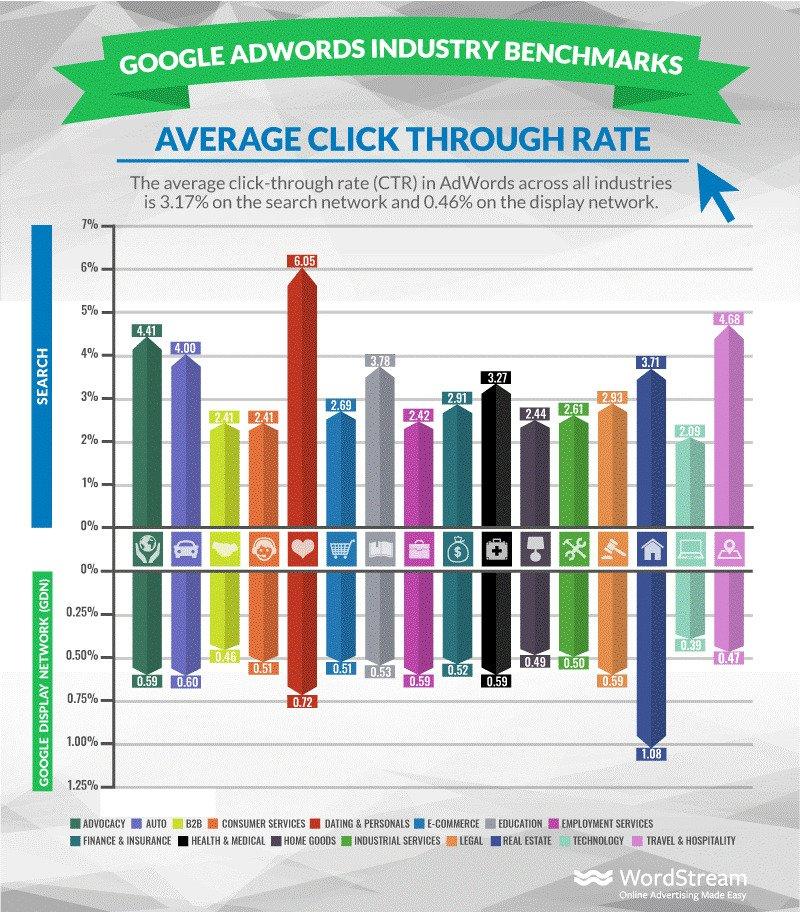
It’s also worth noting that the average conversion rate for Google Ads clicks is 3.75% for search and 0.77% for display.
4. The average cost per click (CPC) in Google Ads across all industries is $2.69 on the search network and $0.63 on the display network.
Another metric to keep an eye on with any PPC campaign is the cost per click or CPC.
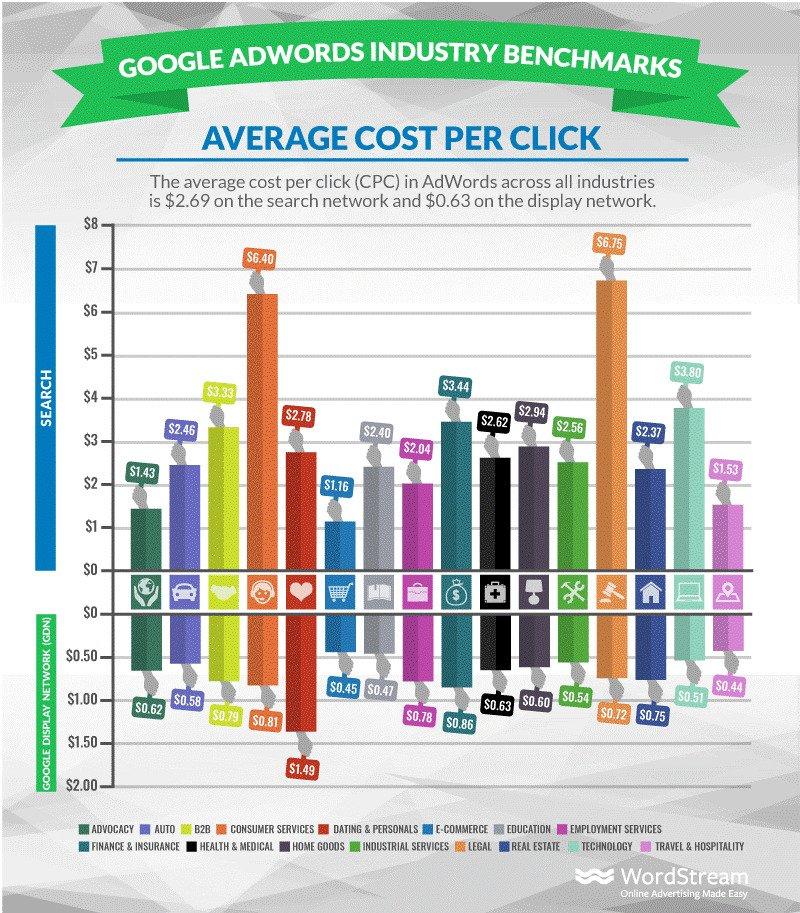
Within the Google Ads platform, the average CPC is over $2 higher for ads in the search results than for those run on the display network.
5. Omnichannel strategies drive an 80% higher rate of incremental store visits for local businesses.
Omnichannel advertising strategies like showing what’s in stock at nearby stores and increasing bids around business locations have become increasingly popular over the past few years.
And as this statistic demonstrates, they’re effective for generating incremental visits, or visits that businesses wouldn’t have received otherwise.
Social Media Statistics
6. Social media platforms capture 33% of the time users spend online.
Effective digital marketing requires reaching your audience where they already spend time online.
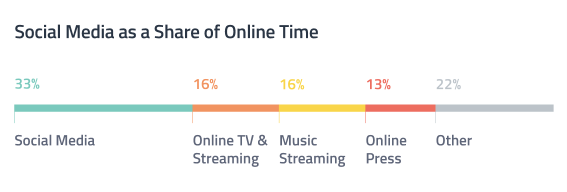
And considering that today’s internet users spend a third of their time on social media, this is a channel most businesses can benefit from including in their strategies.
RELATED: 165 Strategy-Changing Digital Marketing Statistics
7. 4 in 10 internet users say they follow their favorite brands on social media.
Considering that 40% of internet users follow brands on social media, these platforms are natural choices for boosting customer loyalty.
Beyond that, 1 in 4 internet users also follow brands from which they’re considering making a purchase — meaning that even if they aren’t customers yet, the content you share with your followers could be the determining factor in whether they convert.
8. 37% of online shoppers say they use social media for “purchase inspiration.”
Over one-third of online shoppers use social media to “find inspiration” for a purchase.
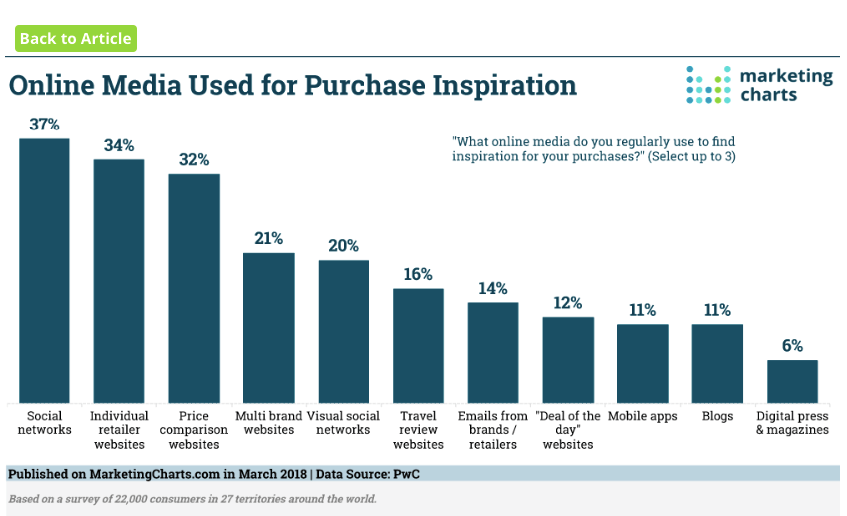
This is higher than any other form of online media, including retailer websites, price comparison websites, and multi-brand websites.
9. 96% of B2C marketers say that Facebook is a valuable marketing platform.
Facebook is still the platform of choice for the majority of B2C marketers.
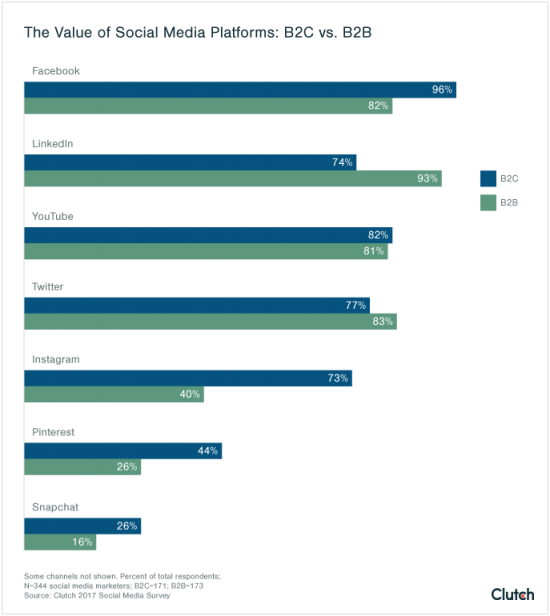
Among B2B marketers, though, LinkedIn has a slight edge, with 93% claiming it as the most valuable platform for their business.
10. 53% of marketers planned to use Twitter more in 2022.
While other platforms like Facebook might still reign supreme, many marketers had Twitter on their 2022 radar. It’s understandable, since ad engagements increased by 35% in 2020, and 80% of users having mentioned a business or brand in a Tweet.
11. The average session duration on Reddit is 4.83 minutes.
Although many advertisers overlook Reddit, its users spend more time per visit than users on Facebook (4.81 minutes), Instagram (3.05 minutes), Twitter (2.76 minutes), and Snapchat (1.79 minutes).
And while successfully marketing on the platform requires a strong understanding of its audience, it’s certainly possible — as illustrated by Findlay Hats, which made $28,000 in sales from one post.
Mobile Advertising Statistics
12. In 2020, there were 3.6 billion smartphone users worldwide.
Odds are, your ideal audience is on their smartphone as we speak just waiting to be captured by mobile advertising!
13. 69% of digital media time is spent on mobile devices.
Mobile advertising has become increasingly important over the past few years.
And considering that internet users now spend over two-thirds of their digital media time on smartphones and other devices, it’s unlikely that it’s going to slow down anytime soon.
14. The average mobile PPC ad click-through rate (CTR) drops 45% between positions one and two.
It’s not news to say that the higher a result or ad is on a results page, the higher its average CTR — but a 45% drop between the first and second ads is significant.
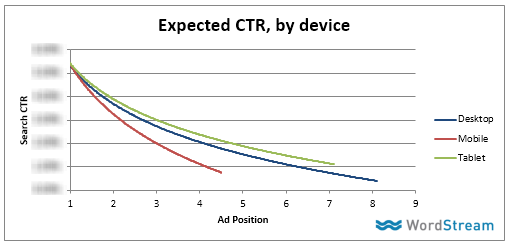
This is much more dramatic than the drop on desktop computers and tablets, and important to keep in mind if you’re optimizing campaigns for mobile devices.
15. Appearing in mobile search ad results can increase brand awareness by 46%.
Making your target audience aware of your brand is an essential step in the sales process and one that mobile search ads can help with.
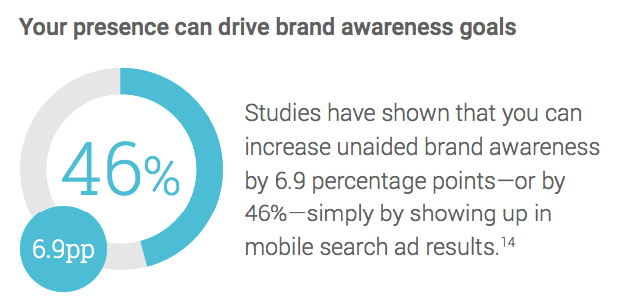
In fact, 51% of smartphone users have discovered a new company or product when searching on their smartphones.
16. 82% of smartphone users consult their phones while in a store.
Mobile devices are becoming increasingly integrated into consumers’ daily lives.
Shoppers now not only use them to find stores in which they can make a purchase but also to continue researching their options once they’ve arrived at a store.
17. 84% of consumers between the ages of 18 and 29 are most likely to use a mobile device when shopping online.
Young online shoppers now overwhelmingly prefer to browse and make a purchase on mobile devices rather than desktop computers.
Consumers in the 18 to 29 age bracket lead this trend but are closely followed by 78% of consumers in the 30 to 44 group.
Email Marketing Statistics
18. Traffic from email marketing campaigns has an average conversion rate of 4.29%.
Although it’s now one of the oldest forms of digital marketing, email still boasts an impressive conversion rate.
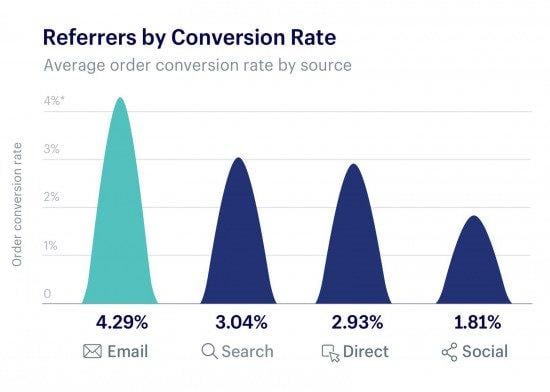
This is higher than the averages for traffic from search, direct, and social media.
19. In 2021, 99% of consumers check their email every day.
There are currently 5.6 billion active email accounts in the world. In a time when it’s hard to guarantee 99% for anything, these are both pretty incredible stats!
20. Revenue from email campaigns made up an average of 21% of companies’ overall revenue, up from 17% in 2016.
Even as more new channels develop, revenue from email campaigns continues to make up a significant portion of digital marketing revenue.

That proportion increased from 2016 to 2017, illustrating that the channel isn’t at risk of losing value to the newer options available to marketers.
21. 65% of marketers believe that dynamic content in email marketing is effective.
When asked to rate the effectiveness of personalization tactics, marketers indicated that dynamic content was the best for their businesses.
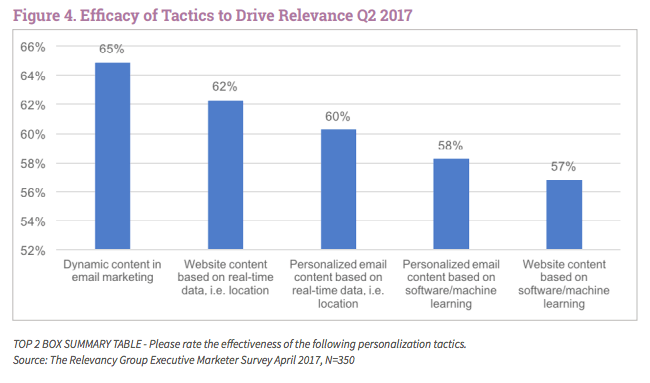
In the same survey, 60% of marketers said personalized email content based on real-time data is effective, and 58% said the same of personalized email content based on software and machine learning.
22. Open rates are 14.31% higher in segmented campaigns than in non-segmented campaigns.
Segmentation is a popular tactic among email marketers, and for good reason.
A study by MailChimp found that segmented campaigns achieve higher open rates, more clicks, lower unsubscription rates, and fewer bounces.
23. 73% of email marketers are prioritizing optimizing email for mobile devices.
Given the importance of catering to mobile users, it makes sense that the majority of email marketers are now making this their top priority for improving campaigns.
Video Advertising Statistics
24. Businesses that used video marketing in 2020 and 2021 reportedly pulled 66% more qualified leads per year.
With consumers becoming more adapt to video content in recent years, it’s no wonder their choice for learning about a product or service would be video. Video can now take consumers down a path to become leads that are qualified, informed, and ready to convert.
25. 64% of consumers say that watching a video on Facebook influenced them to make a purchase.
When marketers first incorporated video into their strategies, it was largely seen as a way to drive engagement.
And while it can certainly be effective for this goal, it also shows clear potential to drive sales and other high-impact conversions.
26. US companies spent $13.23 billion on digital video ads in 2017.
Video has quickly grown in popularity, with US companies spending over $13 billion on video ads in 2017 — and that number has increased to over $22 billion in 2021.
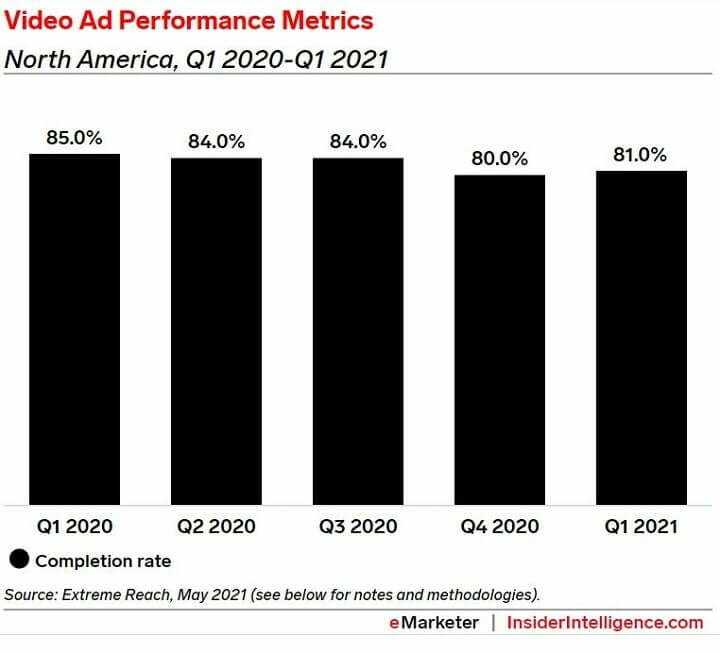
27. Video ad completion rates have steadily increased over the past few years, reaching 80% overall in 2020.
As marketers gain more experience with video, they’ve also become more successful in creating videos that retain viewers’ attention.
28. The average video CTR increased slightly in 2017, up to 0.45% from 0.35% in 2016.
As consumers become more familiar with video, more of them are clicking to learn more about the content they see.
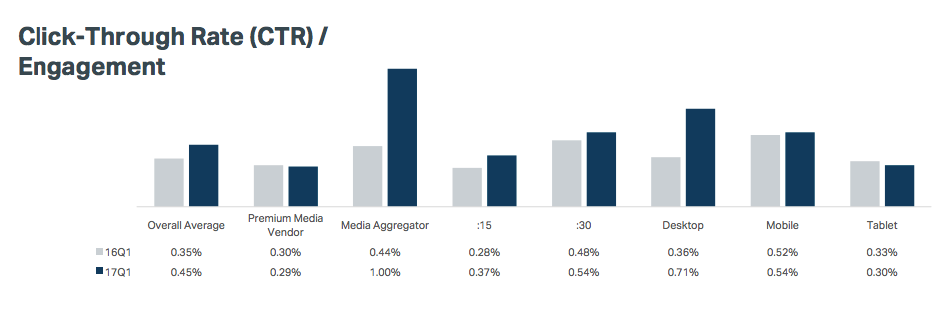
The biggest jump in video CTR was among desktop users, while CTR on tablets slightly decreased.
Consumer Advertising Preferences
29. 73% of consumers dislike pop-up ads.
As an internet user, you’re likely among the majority that dislikes pop-up ads.
In fact, 81% of consumers have closed a browser or exited a webpage because of one — meaning that if you use them as part of your advertising strategy, it’s essential to be cautious of damaging the browsing experience.
30. 72% of consumers want brands to share discounts and sales on social media.
When asked what they want the brands they follow to post on social media, the majority of consumers said discounts or sales.
Unfortunately, only 18% of marketers post these on a regular basis, meaning there’s a disconnect between what consumers want and what brands are delivering.
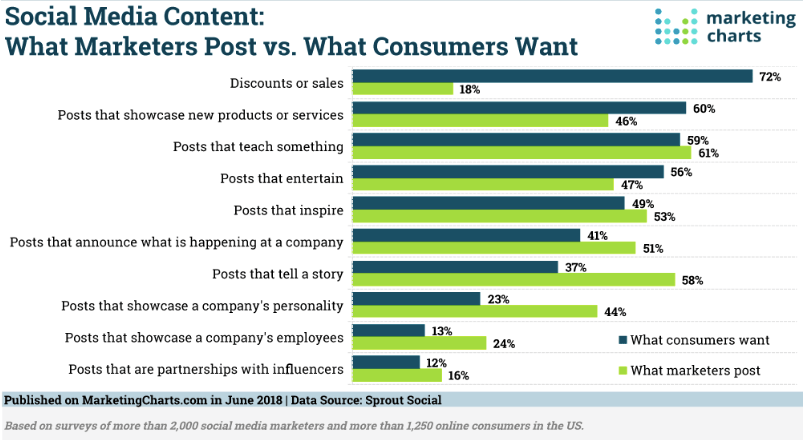
On the flip side, 58% of marketers say they share posts that “tell a story” — but only 37% of consumers want this kind of content.
31. 86% of consumers would like to receive promotional emails “at least monthly.”
Frequency is a difficult element to get right with email marketing. The majority of consumers want to receive promotions at least once per month, but only 15% would like to receive them every day.
The Future of Advertising
32. Amazon’s US ad revenues climbed by 52.5% between 2019 and 2020, at $15.73 billion in total ad revenue for 2020.
Although Google and Facebook are on track to remain the largest two advertising platforms, Amazon is expected to experience significant growth this year and become the third-largest.
33. 57% of marketers believe that influencer marketing will be integrated into all marketing activities in three years.
Influencer marketing has steadily grown in popularity over the past few years, and that growth is expected to continue over the next three years.
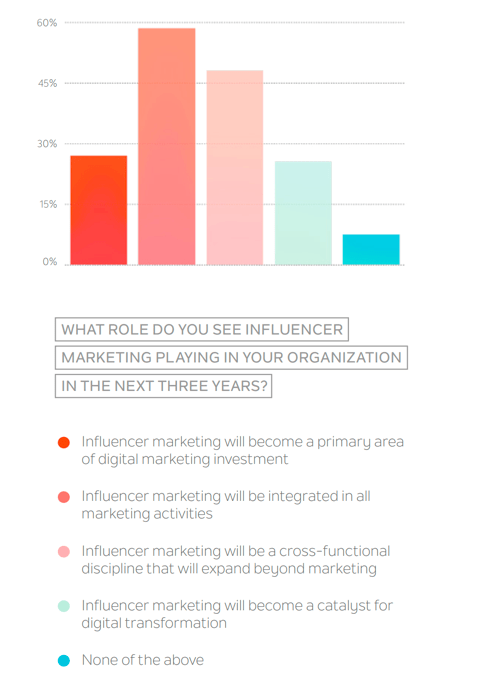
In one survey, 57% of marketers said that influencer marketing will be integrated in all marketing activities, and 47% expect it to become a cross-functional discipline that will expand beyond marketing.
31. Global spending on augmented reality (AR) advertising reached almost $13 billion in 2017.
While many marketers focused their attention on the potential uses of virtual reality (VR) over the past few years, that attention has now shifted to augmented reality (AR).
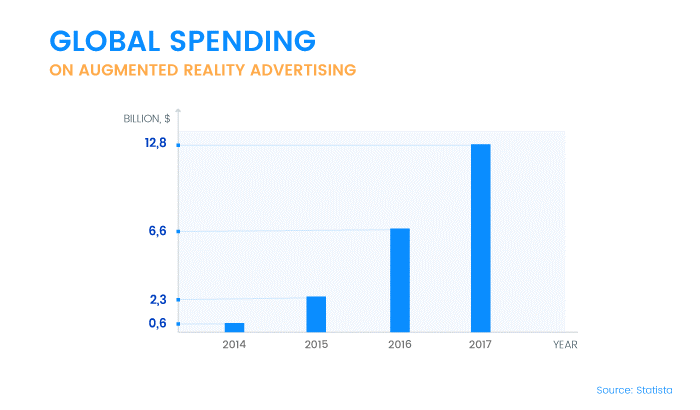
Overall spending on AR nearly doubled in 2017, and that number is predicted to continue increasing.
And considering that AR company Blippar claims that brands have seen 30% higher engagement rates with their advertisements, it’s no wonder that many are shifting their focus toward augmented reality as the next big trend in digital marketing.
Conclusion
The digital advertising industry now changes so rapidly that it can be challenging to keep up, but the statistics above should give you a solid idea of what’s happening with the most important channels.
Still, there’s a constant flow of new data available — so let me know if there’s anything important I missed in the comments below!
Want more? Check out these 11 Legitimately Scary PPC Stats Every Advertiser Should Know!

Meet The Author
Brad Smith
Brad Smith is the founder of Codeless, long-form content creators for SaaS companies. Their work has been featured in The New York Times, Business Insider, TheNextWeb, Shopify, Moz, Unbounce, HubSpot, Search Engine Journal, and more.