NEW Advertising Benchmarks for Home Services in 2021
Update: Get the latest home services search advertising benchmarks here!
Even with the millions of households in the US, the market for home service businesses is a saturated one—making paid advertising an essential marketing strategy for plumbers, roofers, landscapers, and more who want to compete.
But to get a true measure of success, it’s important to know how your ads are performing with respect to other businesses like yours. With benchmark data, you can answer questions like:
- What’s a good conversion rate for home service ads on social media?
- What’s the average click-through rate for home service business ads?
- What’s a good cost per lead for home services advertising?
To help you answer these questions, WordStream and LOCALiQ have partnered up to provide advertising benchmark data for the home services industry. This includes:
- Average click-through rate
- Average cost per lead
- Average conversion rate
- Average monthly budget
For search, display, and social ads across eight key home services vertical subcategories.
Use these averages to see where you stand in your ads’ performance and to inform your home services marketing strategy for 2021 and beyond.
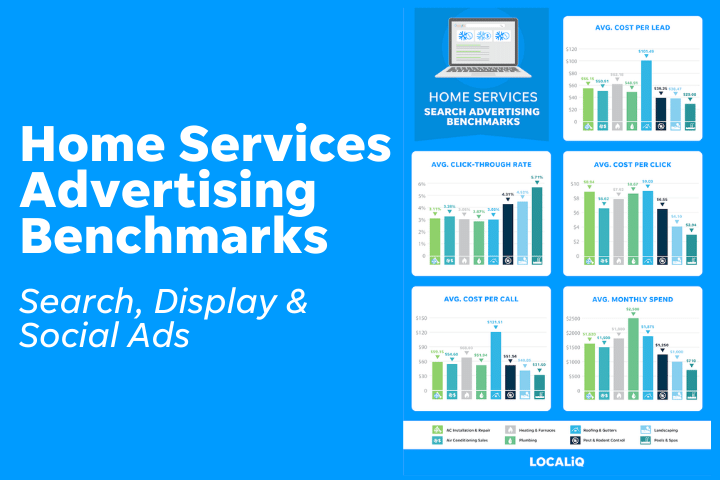
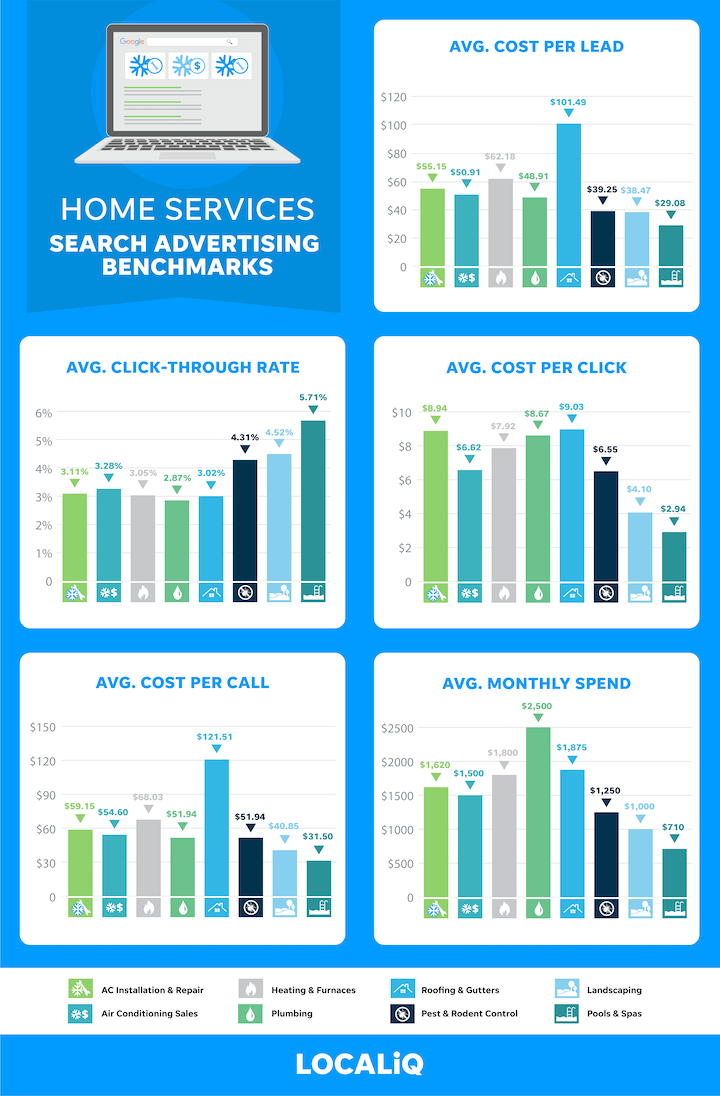
Home services advertising benchmarks: search advertising
| Subcategory | Average Cost Per Lead | Average Click-Through Rate | Average Cost Per Click | Average Cost Per Call | Average Monthly Spend |
| Air Conditioning Services | $55.15 | 3.11% | $8.94 | $59.15 | $1,620 |
| Air Conditioning Sales | $50.91 | 3.28% | $6.62 | $54.60 | $1,500 |
| Heating & Furnaces | $62.18 | 3.05% | $7.92 | $68.03 | $1,800 |
| Plumbing | $48.91 | 2.87% | $8.67 | $51.94 | $2,500 |
| Roofing & Gutters | $101.49 | 3.02% | $9.03 | $121.51 | $1,875 |
| Pest & Rodent Control | $39.25 | 4.31% | $6.55 | $51.94 | $1,250 |
| Landscaping | $38.47 | 4.52% | $4.10 | $40.85 | $1,000 |
| Pools & Spas | $29.08 | 5.71% | $2.94 | $31.50 | $710 |
The search advertising space is notoriously competitive for home service businesses.
Across all categories, the average cost per click ranges from $2.94-$9.03, while the average cost per lead ranges from $29.08 to $101.49. For both of these ranges, the Pools & Spas subcategory was at the low end with Roofing & Gutters at the high end.
Average click-through rates range from 2.87% to 5.71%. The highest rate going to Pools & Spas, the lowest to Plumbing.
Overall, each of these subcategories has high engagement with their ads at a relatively low cost per lead, with respect to the overall return on investment from their search advertising campaigns. For example, the average plumbing job totals $175 to $400, which would be a return on investment of 257-717%.
Where can you improve in your account? Find out with our free Google Ads Performance Grader.
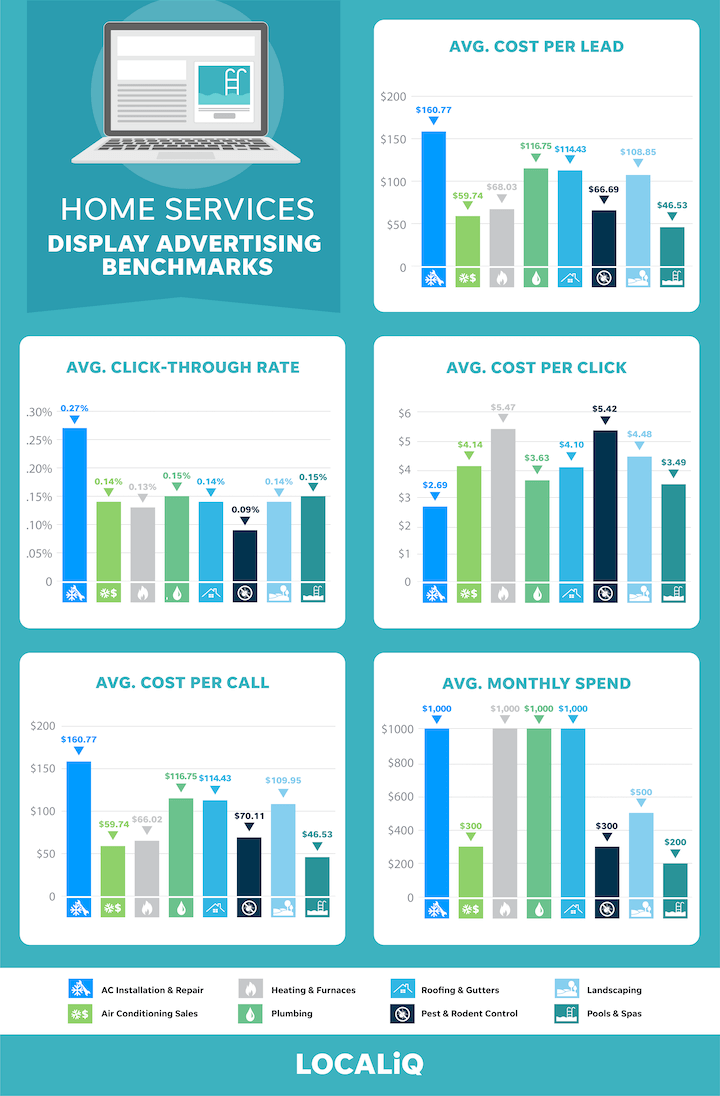
Home services advertising benchmarks: display advertising
| Subcategory | Average Cost Per Lead | Average Click-Through Rate | Average Cost Per Click | Average Cost Per Call | Average Monthly Spend |
| Air Conditioning Services | $160.77 | 0.27% | $2.69 | $160.77 | $1,000 |
| Air Conditioning Sales | $59.74 | 0.14% | $4.14 | $59.74 | $300 |
| Heating & Furnaces | $68.03 | 0.13% | $5.47 | $66.02 | $1,000 |
| Plumbing | $116.75 | 0.15% | $3.63 | $116.75 | $1,000 |
| Roofing & Gutters | $114.43 | 0.14% | $4.10 | $114.43 | $1,000 |
| Pest & Rodent Control | $66.69 | 0.09% | $5.42 | $70.11 | $300 |
| Landscaping | $108.85 | 0.14% | $4.48 | $109.95 | $1500 |
| Pools & Spas | $46.53 | 0.15% | $3.49 | $46.53 | $200 |
For any industry, display ads typically have lower engagement rates than search ads, and we see this in the home services benchmark data.
The average CTR for display ads ranges from 0.09% to 0.27% (compared to 2.87% to 5.71% for search ads).
But that doesn’t make this campaign type any less valuable. Not only do display ads drive brand awareness—which is especially important in such a highly saturated market—but they also improve conversion rates on your other advertising channels.
And given the average monthly spend on display campaigns for home service businesses, we can see that this is a relatively small investment for something that can have such a big impact.
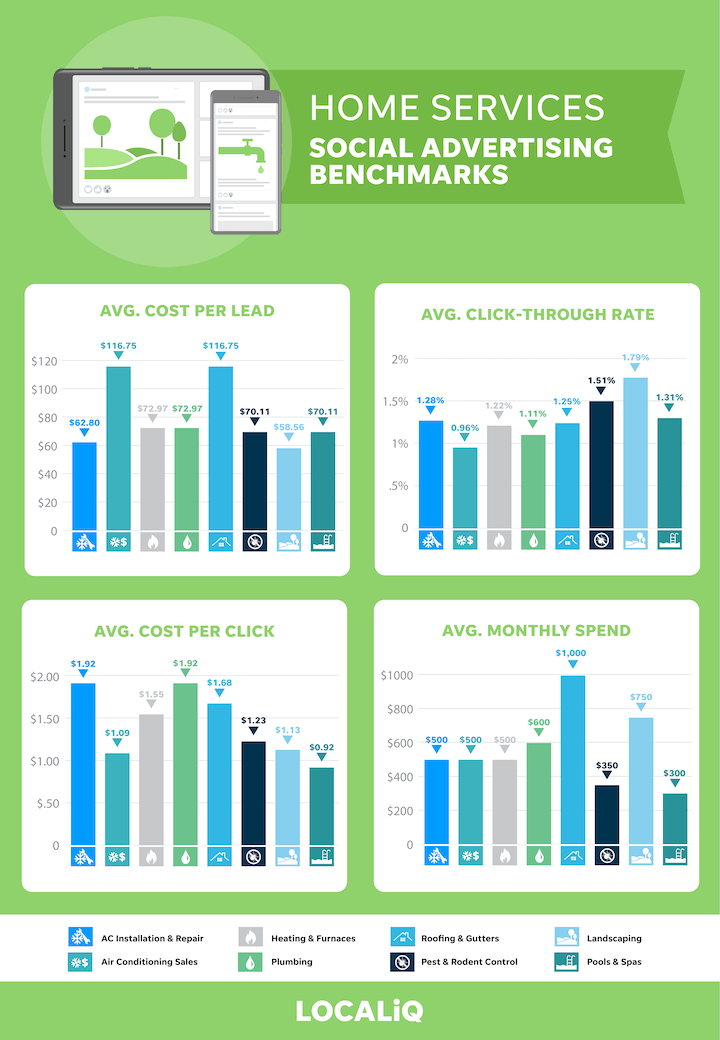
Home services advertising benchmarks: social ads
| Subcategory | Average Cost Per Lead | Average Click-Through Rate | Average Cost Per Click | Average Monthly Spend |
| Air Conditioning Services | $62.80 | 1.28% | $1.92 | $500 |
| Air Conditioning Sales | $116.75 | 0.96% | $1.09 | $500 |
| Heating & Furnaces | $72.97 | 1.22% | $1.55 | $500 |
| Plumbers | $72.97 | 1.11% | $1.92 | $600 |
| Roofers & Gutters | $116.75 | 1.25% | $1.68 | $1,000 |
| Pest & Rodent Control | $70.11 | 1.51% | $1.23 | $350 |
| Landscaping | $58.56 | 1.79% | $1.13 | $750 |
| Pools & Spas | $70.11 | 1.31% | $0.92 | $300 |
Social media platforms like Facebook, Instagram, and YouTube may not be the first that jump to mind for home service business marketing—until you think about how many homeowners use videos and photos on these platforms to get ideas for, troubleshoot, and fix things in their homes.
For home service businesses advertising on social media, the average CTR ranges from 0.96% to 1.79%, with average cost per click ranging from $0.92 and $1.92.
Additionally, many of the subcategories we analyzed see a promising cost per lead, especially when compared to the average yield of $175-$400 per job that was mentioned above.
To find out how you can optimize your Facebook ads, use our free Facebook Ads Performance Grader.
Improve your home services advertising results
Advertising costs and ROI will vary according to whether your business falls under plumbing, HVAC, pools and spas, landscaping, or another category. Costs will also vary within those categories depending on your budget, location, and other factors.
But with these home services advertising benchmarks, you can still get a general idea as to where you stand in relation to other businesses like yours, and identify campaigns that should be harnessed and those that could use some improvement.
You may also be interested in:
- 2022 Search advertising benchmarks for the top 23 industries
- 2021 Real estate advertising benchmarks
- 2021 Healthcare advertising benchmarks
Data sources
This report is based on a sample of 4,595 North American-based LOCALiQ client accounts in the home services vertical who were running search advertising, display advertising, and/or social media advertising between May 1, 2020, and June 25, 2021. Each subcategory includes at minimum 10 unique active clients. “Averages” are technically median figures to account for outliers. All currency values are posted in USD.

Meet The Author
Kristen McCormick
Kristen is the Head of Marketing at Hatch, a customer communication platform for service-based businesses. She was previously the Senior Managing Editor at WordStream. Her cat Arnold has double paws on every paw, and she finds life to be exponentially more delightful on a bicycle.


Comments
Please read our Comment Policy before commenting.