This post is the first in our series on Google AdWords reporting via the AdWords dimension tab. Today we’ll cover the AdWords time report. This report is pretty flexible and allows you to slice date-based data in a variety of different ways, so understanding how it works can be valuable for anyone managing a pay-per-click campaign.
What AdWords Reports Live within the “Time” Drop-Down?
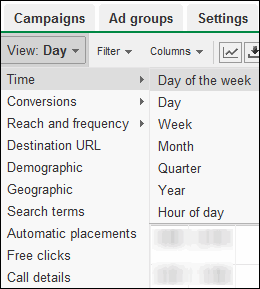
There are seven reports you’ll find within the AdWords time drop-down. Obviously the labels themselves give you a pretty good idea of what unit of time each of these items is focused on, but we’ll walk through what you might use each of these reports for:
- Day of the Week – This is breaking down a period of time (e.g., the last six months) by day of the week. Your business might (or might not) perform well on weekends, or you might see a lower CPA on Wednesdays. If that’s the case, you can push more budget at those days that perform better.
- Day – The day segmentation can be very useful in helping you understand trends over time, either account-wide or within specific groups and campaigns. This is a useful report to export into Excel so that you can better manipulate the data with pivot tables. There’s also been a recent tweak to this report that makes the data easier to interpret.
- Week – Weekly data is also helpful to analyze trends by week – this can be a helpful snapshot to look at when you need a date range that’s between daily and monthly data.
- Month – Monthly data obviously lets you get a quick, very high level snap shot of various trends and how campaigns perform through a given season, particularly if you’re new to a specific account.
- Quarter – The quarter and yearly data can be useful for getting a quick historical snapshot, particularly as you first get acquainted with an account, but you aren’t likely to use these extensively in day-to-day management.
- Year – See quarterly breakdown above.
- Hour of Day – Similarly to day of the week, you can get insights into which times of the day different campaigns perform well, and allocate budgets accordingly.
Why Would I Want to Spend Time with These Reports?
At a high level, there are three good use cases for diving into this data:
- Dayparting – As I mentioned you may want to look at day of week and/or hour of day data to better optimize the way you’re allocating your budget.
- Reporting & Trend Analysis – The “day” report can be very helpful in helping you understand different trends for a number of different data points – both at a high level (account wide) and at the ad group and campaign levels.
- Seasonality & Historical Data – As I mentioned reports like the monthly, quarterly, and yearly views can help you understand historical account information, longer-term trends, and seasonality for the query space and the campaigns.
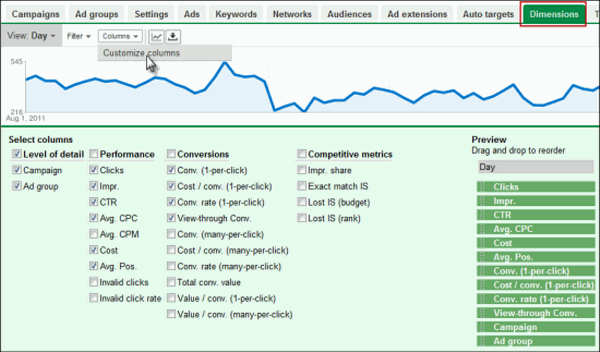
Two things to note with diving into this data are that it’s likely you’ll get much more meaningful insights by manipulating the data in Excel, and that you’ll want to customize columns to make sure the data you’re looking for – both in terms of the dimensions or “level of detail” (campaigns and ad groups) and the metrics (cost, CPA, etc.) – are in your report:


