Whether you’re managing paid search for a local business or you’re the VP of Marketing for a national brand, you’ve certainly discovered that entering a new market can always be a daunting undertaking. Our country is a melting pot of different demographics, interests, and what we’re searching for differs in each state.
Well, this all plays into how smart advertisers structure their campaigns and ultimately what they pay per click in each state. How much PPC costs, it turns out, depends on what state you live in. What states cost us the most per click? We dug into the PPC cost data and created this infographic showing the most and least expensive states for paid search advertising based on average local cost per click (CPC):
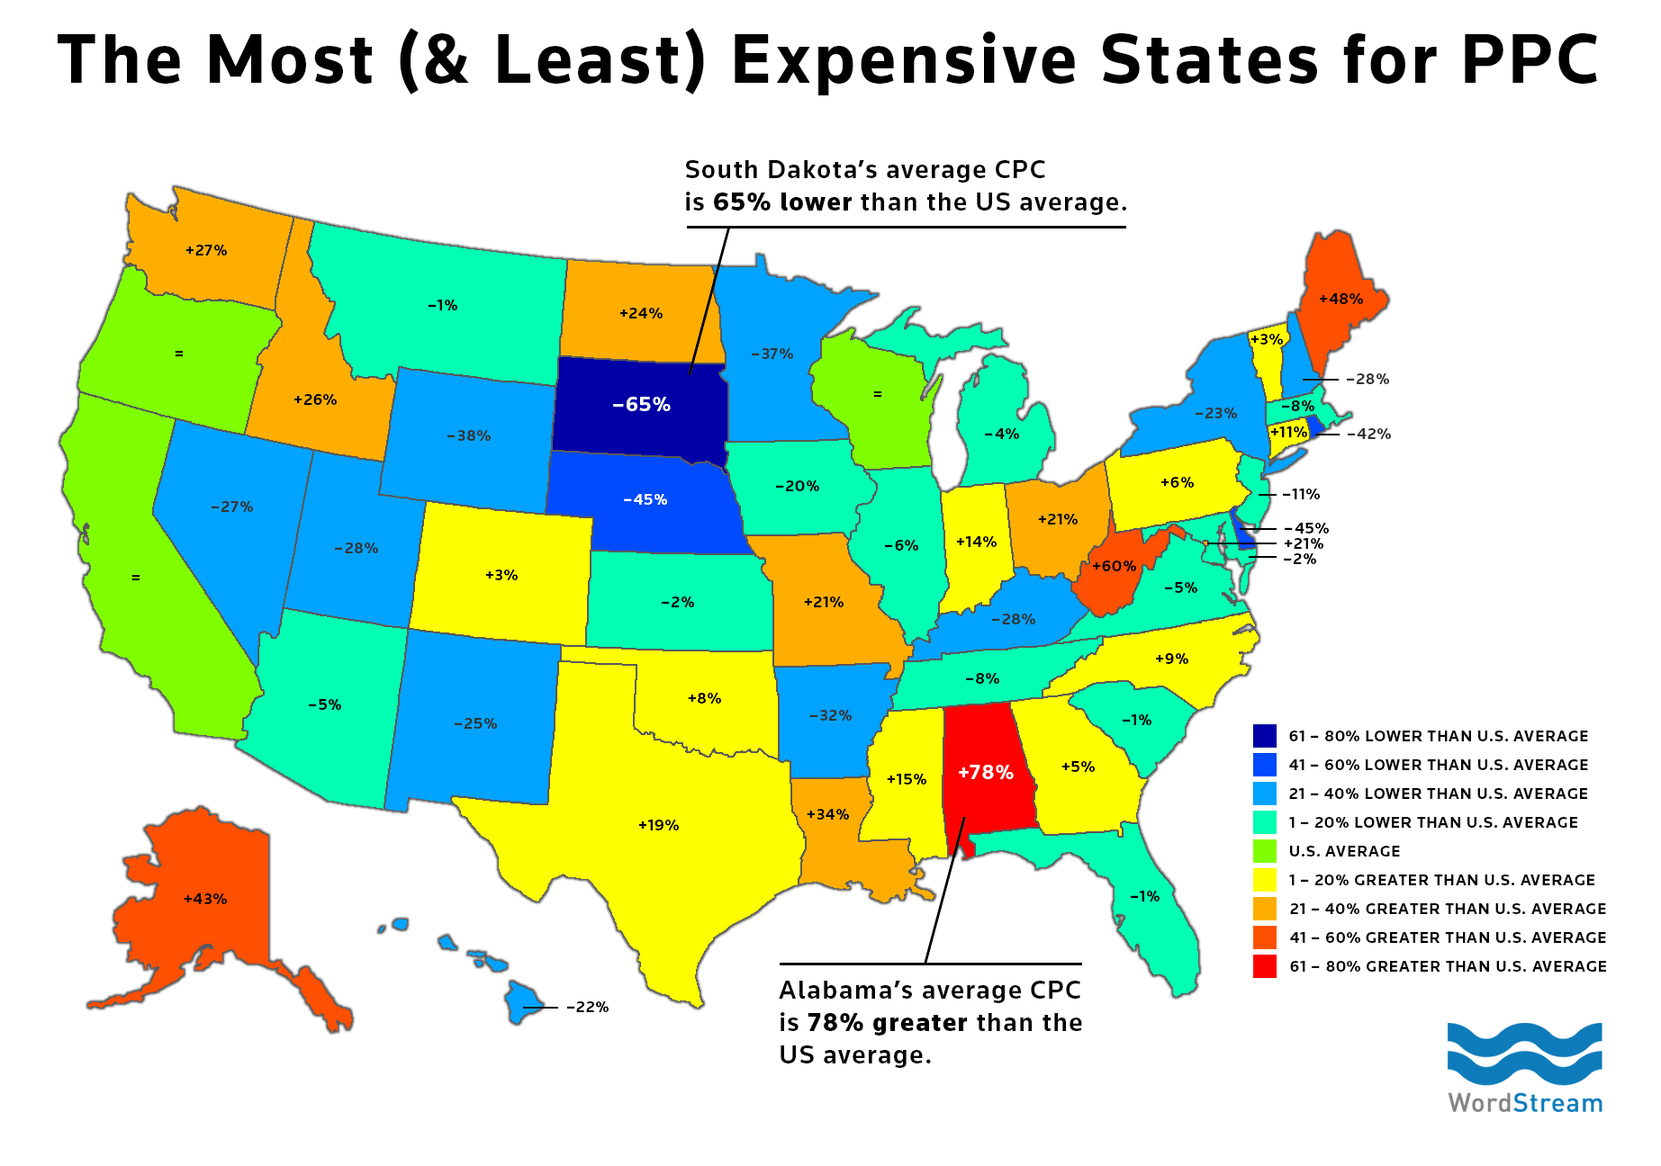
Below are all 50 states, ranked in order of the average CPC in each state from highest (most expensive) to lowest (least expensive):
- Alabama has an average CPC 78 percent greater than the US average.
- West Virginia has an average CPC 60 percent greater than the US average.
- Maine has an average CPC 48 percent greater than the US average.
- Alaska has an average CPC 43 percent greater than the US average.
- Louisiana has an average CPC 34 percent greater than the US average.
- Washington has an average CPC 27 percent greater than the US average.
- Idaho has an average CPC 26 percent greater than the US average.
- North Dakota has an average CPC 24 percent greater than the US average.
- Missouri has an average CPC 21 percent greater than the US average.
- District of Columbia has an average CPC 21 percent greater than the US average.
- Ohio has an average CPC 21 percent greater than the US average.
- Texas has an average CPC 19 percent greater than the US average.
- Mississippi has an average CPC 15 percent greater than the US average.
- Indiana has an average CPC 14 percent greater than the US average.
- Connecticut has an average CPC 11 percent greater than the US average.
- North Carolina has an average CPC 9 percent greater than the US average.
- Oklahoma has an average CPC 8 percent greater than the US average.
- Pennsylvania has an average CPC 6 percent greater than the US average.
- Georgia has an average CPC 5 percent greater than the US average.
- Colorado has an average CPC 3 percent greater than the US average.
- Vermont has an average CPC 3 percent greater than the US average.
- Oregon has an average CPC consistent with the US average.
- California has an average CPC consistent with the US average.
- Wisconsin has an average CPC consistent with the US average.
- Montana has an average CPC 1 percent less than the US average.
- South Carolina has an average CPC 1 percent less than the US average.
- Florida has an average CPC 1 percent less than the US average.
- Kansas has an average CPC 2 percent less than the US average.
- Maryland has an average CPC 2 percent less than the US average.
- Michigan has an average CPC 4 percent less than the US average.
- Virginia has an average CPC 5 percent less than the US average.
- Arizona has an average CPC 5 percent less than the US average.
- Illinois has an average CPC 6 percent less than the US average.
- Tennessee has an average CPC 8 percent less than the US average.
- Massachusetts has an average CPC 8 percent less than the US average.
- New Jersey has an average CPC 11 percent less than the US average.
- Iowa has an average CPC 20 percent less than the US average.
- Hawaii has an average CPC 22 percent less than the US average.
- New York has an average CPC 23 percent less than the US average.
- New Mexico has an average CPC 25 percent less than the US average.
- Nevada has an average CPC 27 percent less than the US average.
- Utah has an average CPC 28 percent less than the US average.
- New Hampshire has an average CPC 28 percent less than the US average.
- Kentucky has an average CPC 28 percent less than the US average.
- Arkansas has an average CPC 32 percent less than the US average.
- Minnesota has an average CPC 37 percent less than the US average.
- Wyoming has an average CPC 38 percent less than the US average.
- Rhode Island has an average CPC 42 percent less than the US average.
- Delaware has an average CPC 45 percent less than the US average.
- Nebraska has an average CPC 45 percent less than the US average.
- South Dakota has an average CPC 65 percent less than the US average.
Average CPC by US State: Methodology
To determine the relative CPC for each state, I used our free keyword tool to create a list of over 15,000 high volume English search keywords across over 20 different industries. I then took this list and ran it through the Google Keyword Planner to get average CPC estimates for these keywords in each state & the entire US to see how Google estimated their costs per clicks would differ in each state. With this list of estimated CPCs by state, I then indexed it and compared each state’s estimated CPC against the estimated CPC of the whole US to complete this analysis.
Having this data be as unbiased as possible was a priority for me. The decision to use estimates from the Google Keyword Planner data protects this research from any biases from individual clients who target different states or use geo bid modifiers. The volume of keywords considered across different industries protects this analysis from a bias of a rogue keyword or industry with spiked regional interest.
Notable Trends in Average PPC Costs
There are some interesting trends in this regional CPC data.
Rural Regions Have Higher CPC
The top 5 states (Alabama, West Virginia, Maine, Alaska & Louisiana) fill out a much more rural profile than the US average. With fewer nearby businesses, it’s very likely that these states’ residents more frequently turn to Google when they look for a service or product. Consequently, advertisers have more to gain from bidding aggressively in these markets.
The Biggest States Fall in the Middle
Of the 10 most populated states, not a single one made the top 10 or the bottom 10. For instance, the most populated state, California, sits nearly directly in the middle at #23 with a CPC similar to the US average. This is likely telling us that many advertisers targeting these regions are doing so in the same campaigns targeting the rest of the nation – driving their average CPCs closer to the national average.
Low Unemployment Rates Mean Low PPC Costs
I thought this was interesting: 9 of the 10 states with the lowest average CPCs also have unemployment rates below the national average – in most cases by a comfortable margin (Rhode Island was the sole exception here). Full employment is typically a sign of lots of local businesses in the area – so there’s less need for local users to need to turn to Google to fulfill their needs and advertisers don’t need to be as aggressive with their bids.
Do you see any other interesting trends in the data? Are you seeing similar trends in your accounts or in your industry?
Are you wasting money in Google Ads?

Meet The Author
Mark Irvine
Mark is the Director of PPC at SearchLab Digital. Previously, Mark worked at WordStream and was named the Most Influential PPC Expert of the Year by both PPC and Microsoft.
Recommended for you