Your ecommerce business doesn’t exist in a vacuum—it’s a part of the global ecommerce ecosystem. That’s why you need to pay attention to the broader context in order to make the best decisions—and that means staying on top of the latest ecommerce statistics.
What do customers expect? What are their preferences? What is driving their behavior?
Ecommerce statistics can help you see the big picture by answering these questions and more.
That’s why we’ve gathered the top 45 ecommerce statistics that you need to know.
Ecommerce statistics: Amazon
- Amazon is the leading online retailer with a net revenue of $232.88 billion in 2018. (Statista)
- Amazon has over 100 million Amazon Prime members. (Jeff Bezos in a letter to shareholders)
- Other sources estimate that there are over 95 million Amazon Prime members in the United States. (Statista)
- On average, two in five US consumers (41%) receive one to two packages from Amazon per week. That number jumps to half (50%) for consumers ages 18-25, and 57% for consumers ages 26-35. (Walker Sands)
- In the last six months, 83% of US consumers have made a purchase on Amazon. (BigCommerce)

Key takeaway: Amazon is shaping the expectations of your customers
Consider Amazon Prime. 95 million people is almost a third of the US population. And now they are used to free two-day shipping. Do you think they will be understanding if you send them a shipping bill and inform them that it will take a standard seven to 10 days for their order to arrive? Probably not.
This means that you also need to figure out how to offer free two-day shipping, without destroying your margins.
Keeping up with Amazon is not an easy task, but you have to do your best. Otherwise, you will struggle to stay afloat, much less grow.
Ecommerce statistics: Google Shopping
- The average amount of time between a Google product search and a purchase is 20 days (it’s 26 days on Amazon). (Jumpshot)
- 35% of Google product searches turn into transactions within 5 days. (Jumpshot)
- Google Shopping ad spend was up 43% YoY in Q4 of 2018, making the quarter the fastest growth rate in two years. (Merkle)
- Cross-device targeting yields 16% more conversions for retail advertisers in the US. (Google)
- Google Shopping ads have a higher CTR than Amazon’s Sponsored Product and Sponsored Brand ads. (Merkle)
Key takeaway: Ecommerce advertisers can’t skip Google Shopping
Amazon might be dominating the ecommerce industry, but it’s far from the only place potential consumers are searching for products and making purchases.
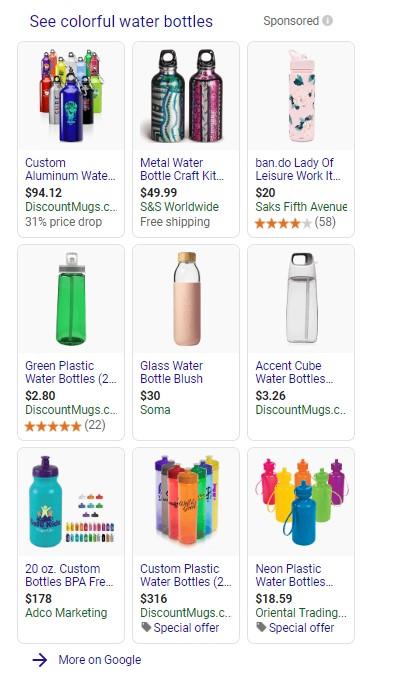
In fact, Google Shopping might even be a better bet. The platform has a quicker transaction turn-around, and a higher-rate of searches converting a few days later.
What does this mean for ecommerce advertisers? Simple: Make sure you’re using Google Shopping to promote your products.
Download our free guide to Google Shopping and you’ll learn what it takes to build a killer ecommerce advertising campaign!
Ecommerce statistics: Shipping & delivery
- 79% of US consumers said that free shipping would make them more likely to shop online. (Walker Sands)
- 54% of US consumers under the age 25 said that same-day shipping is their number one purchase driver. (Walker Sands)
- Only 15% of US consumers said that online retailers always offer shipping options that meet their expectations for speed of delivery, compared to 30% that report the same for Amazon. (Walker Sands)
- 83% of US online shoppers expect regular communication about their purchases. (Narvar)
- 53% of US online shoppers won’t purchase a product if they don’t know when it will arrive. (Narvar)
Key takeaway: Ecommerce customers expect free and fast shipping
We have already discussed how Amazon has set the standard for shipping cost and speed.
According to Walker Sands, “With fast and free shipping as a key driver for online and cross-channel purchases for the fifth year in a row, the biggest opportunity for brands and retailers lies with creating more efficiencies in the supply chain.”
Here are two things that you should consider:
- Offering free shipping above a certain threshold (e.g., $50 or $100—whatever makes the math work out in your favor) and promote this perk.
- Partnering with a third-party logistics (3PL) company that can store your inventory and fulfill the orders.
For example, iloveplum increased their average order value by 97% by partnering with a 3PL company ShipBob, which allowed them to offer free two-day shipping within the US for orders above $40.
In short, when it comes to free and fast shipping, you have to make an effort to meet the expectations of your customers.
Ecommerce statistics: Returns
- 42% of US online shoppers have returned an item they bought online in the last six months. (Narvar)
- 63% of US online shoppers said that they would not make a purchase if they couldn’t find the return policy. (Narvar)
- Nearly 70% of US online shoppers said that their most recent return experience was “easy” or “very easy,” and 96% would buy from that retailer again based on that experience. (Narvar)
- 59% of US online shoppers said that they want to receive notifications about the status of their refund. (Narvar)
- 41% of US online shoppers said that they “bracket” at least some online purchases (“bracketing” refers to buying multiple versions of the same item, then returning those that didn’t work). (Narvar)
Key take away: Online customers expect an easy way to return the items they bought
Returns are part and parcel of ecommerce.
There’s no way to avoid them. After all, people can’t see, touch, or try the products before they buy them—they’re basing their decision on your product photography. It’s inevitable that sometimes the product won’t work out as expected, and there is always the possibility of a manufacturing defect or damage during the delivery process.
Moreover, a large percentage of customers buy with an intent to return some of the items, a practice known as “bracketing.”
You can take some steps to reduce the number of returns:
- Package your products well to protect them from damage.
- Display accurate information about your products on the product pages.
- Help the customers figure out whether a product will be a good fit for them by providing additional information on the product page (for example, size charts for clothes).
You should make it as easy as possible for the customer to return or exchange an item they are not happy with. This includes making your return policy easy to understand and to locate. Your customers shouldn’t have to scour your entire website in order to find it. Display it prominently to reassure your customers that if something goes wrong, you’ve got their back.
RELATED: 165 Strategy-Changing Digital Marketing Statistics
Ecommerce statistics: Cart abandonment
- The average global cart abandonment rate in Q3 of 2018 was 76.9%. (SaleCycle)
- 58.6% of US online shoppers have abandoned a cart within the last 3 months because “I was just browsing/not ready to buy.” (Baymard Institute)
- The top three reasons US online shoppers give for abandoning a cart during checkout are high extra costs, the need to create an account, and a complicated checkout process (these are the survey results after removing the “I was just browsing/not ready to buy” segment). (Baymard Institute)
- The average open rate for an abandoned cart email is 15.21%, and the average click-through rate is 21.12% for SmartrMail users. (SmartrMail)
- The average revenue per email for an abandoned cart email is $27.12 (for SmartrMail users). (SmartrMail)
Key takeaway: You can reduce cart abandonment by optimizing the checkout process and sending abandoned cart emails
Cart abandonment is another inevitable part of ecommerce.
As Baymard Institute put it, “Now in all fairness to the ecommerce industry, a large portion of cart abandonments are simply a natural consequence of how users browse ecommerce sites—many users will be doing window shopping, price comparison, saving items for later, exploring gift options, etc. These are largely unavoidable cart and checkout abandonments.”
However, that doesn’t mean you should just accept your current cart abandonment rate, because chances are you could significantly reduce it.

As you can see, you could fix the top three issues by offering free shipping, allowing customers to check out as guests, and streamlining your checkout flow.
Moreover, if a customer abandons their cart, you don’t have to just leave it at that; you can send them an email to remind them of the products they were interested in buying.
In fact, according to SmartrMail statistics, abandoned cart emails are the most profitable type of email that you can send as an online retailer:
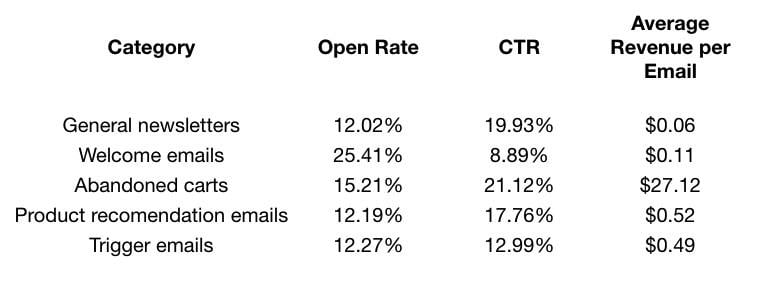
“In terms of average revenue per email, abandoned cart emails are a clear outlier. This is because they are only sent to people who are highly likely to convert seeing as they have already made it all the way to the checkout,” explains Aaron Wiseman from SmartrMail.
So don’t hesitate to reach out to customers who have abandoned their carts.
Ecommerce statistics: Conversational commerce
- The top three messaging apps have user bases of 1 billion or more. (Business Insider)
- 61% of US consumers say that they have messaged a business in the last 3 months. (Facebook)
- 70% of the US consumers who message businesses expect a faster response than they would have gotten had they used a more traditional mode of communication. (Facebook)
- 69% of US consumers who message businesses say that being able to message a business helps them feel more confident about the brand. (Facebook)
- 29% of US online shoppers use or plan to use chatbots to shop online. (Narvar)
Key takeaway: Messaging is changing ecommerce
Contacting a business via Whatsapp, Facebook Messenger, or any other messaging app was a novel idea not that long ago. However, as these apps keep growing in popularity, more and more online retailers are offering their customers this option. And customers seem to appreciate it. After all, sending a message is quick and easy, and it feels more casual than an email or a phone call.
Moreover, people are becoming more open to chatbots.
According to Narvar, “Bot use is nascent but growing. As natural language processing improves and consumers gain more exposure to new interactive channels, it’s likely shoppers will become more comfortable interacting with bots to resolve simple customer care issues.”
Chatbots are a great way to scale customer service. Using them allows you to respond to simple inquiries immediately, at any time of the day, seven days a week. Meanwhile, your customer service representatives are free to focus on solving more complicated issues.
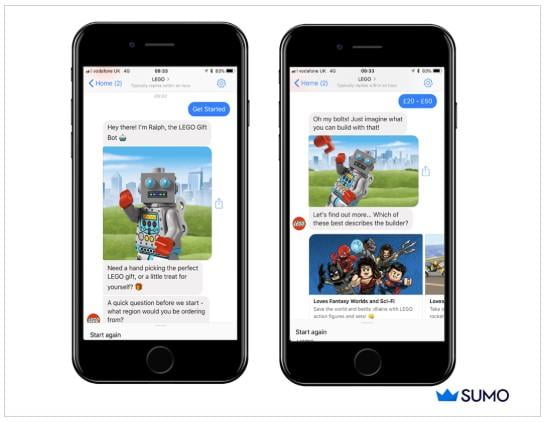
For example, Lego has a chatbot named Ralph that provides the customers with personalized gift recommendations, which would not be sustainable if customer support representatives did it instead.
Providing your customers with the option to contact you via messaging apps can help you get an edge over your competitors by taking your customer service to the next level.
Ecommerce statistics: Instagram
- 83% of people say Instagram helps them discover new products and services. 81% say the platform helps them research products and services, and 80% say it helps them decide whether to make a purchase. (Facebook)
- Compared to non-users, Instagram users are 70% more likely to make online purchases on their mobile devices. (GlobalWebIndex)
- 44% of active Instagram users say they use social media to conduct brand research. That’s the highest percentage among the major social networks. (GlobalWebIndex)
- Engagement between users and brands on Instagram is 10 times greater than it is on Facebook, 54 times greater than it is on Pinterest, and 84 times greater than it is on Twitter. (Forrester)
- 96% of fashion brands based in the US use Instagram to reach consumers. (eMarketer)
Key takeaway: Instagram users like to buy stuff
The conventional wisdom is that search marketing is for capturing commercial intent and driving site traffic and that social marketing is for targeting audiences and building brand awareness. That’s all well and good.
But don’t get it twisted: You can sell on social. Do people use Instagram to keep up with friends and family and—for some reason—to flex on distant acquaintances? Of course they do. But people also use Instagram to discover new brands and find inspiration for future purchases.
So, not only does your ecommerce business need to start posting on Instagram—your ecommerce business also needs to start selling on Instagram. Otherwise, you’re missing tons of opportunities to turn users’ commercial mindsets into revenue.

Whether it’s tagging the products in your News Feed and Story posts with names and prices or partnering with influencers to get your catalog in front of hyper-engaged audiences, there are proven ways to make your Instagram presence shoppable. Don’t procrastinate.
Ecommerce statistics: Mobile devices
- Nearly 40% of all online purchases made during the 2018 holiday season were done on smartphones. (OuterBox)
- 80% of Americans are online shoppers. More than half of them have made purchases on mobile devices. (Pew Research Center)
- People who have a bad mobile experience with your business are 62% less likely to become your customer in the future. (Google)
- 69% of smartphone users say they’re more likely to buy from businesses with mobile sites or apps that answer their questions. (Google)
- 59% of smartphone users favor businesses with mobile sites or apps that enable them to make purchases easily and quickly. (Think with Google)
Key takeaway: Mobile UX directly impacts your revenue
You’ll often hear digital marketers talk about user experience, which is typically abbreviated as UX. It’s sort of a catch-all term that refers to how well your website is built—and, in turn, how easily people can navigate it to accomplish whatever it is they need to accomplish.
In the case of your ecommerce website, a good UX enables your site visitors to quickly find the product information they need and to make purchases when they’re ready. If you bury key product details in the darkest corners of your site and make prospects jump through a series of hoops to make purchases, you’re not offering a good UX.
Make it easy for users to get where they need to go.
The stats you see above make it plain. If you give online shoppers a good mobile UX, they’ll reward you by making purchases. And if you give them a bad mobile UX, they’ll punish you by giving their money to your competitors.
You can learn more about building a good mobile website here.
Ecommerce statistics: Conversion rates
The stats for this final section come from our brand new Shopping Benchmarks report—a deep dive into how ecommerce businesses from 16 different verticals are performing on Google Shopping and Bing Shopping.
- Across all verticals, the average Google Shopping conversion rate is 1.91% and the average Bing Shopping conversion rate is 1.74%.
- Although you can expect to convert Google shoppers at a higher rate, you’ll have to pay a premium for it. Whereas the average Google Shopping CPA is $38.87, the average Bing Shopping CPA is only $23.05.
- Ecommerce businesses in the Office & Business Needs vertical are killing it on Bing Shopping: they convert clicks into actions at an average rate of 15.19%.
- Turning to Google Shopping, HVAC businesses are killing it, too: They boast an average conversion rate of 3.30% and an average CPA of just $7.28.
- Advertisers in the Chemical & Industrial sector have one of the toughest jobs out there: less than 1% of their Google Shopping clicks convert into actions, and each conversion they do get costs $91.21 on average.
Key takeaway: Multi-channel is the way to go
Often, marketers take one look at Bing’s share of the search engine market—anywhere between 3% and 5%, depending on where you look—and write if off completely. Although every business has unique goals and limitations, we generally recommend giving Bing Ads a shot.
Why? Because 4% of search engine users is millions of people. Millions of people—some of whom, we’re willing to bet, being qualified to be your customers—use Bing every single day to find the solutions to their problems. If you have the bandwidth to run a couple Bing Shopping campaigns and get your catalog in front of those people, why wouldn’t you?
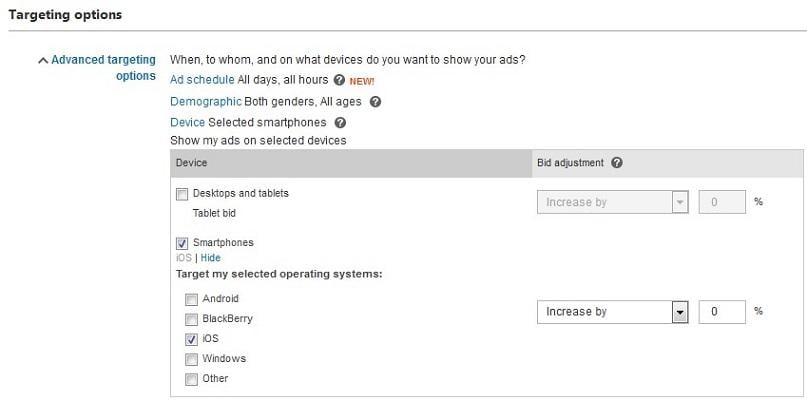
We’re big fans of Bing Ads’ device targeting functionalities.
We’ve already show that conversions cost way less on Bing Shopping. And try this one on for size: Whereas the average Google Shopping advertiser spends $770 per month, the average Bing Shopping advertiser spends half that much. Not only can you expect to drive conversions at a low cost—you can expect to face less competition for the top sponsored spots, too.
And by the way: Bing users tend to be middle-aged an affluent. If that sounds like your buyer persona, Bing Shopping is a no-brainer.
Using ecommerce statistics to inform your strategy
It’s true that it’s not possible to know what lies ahead.
That being said, here are some predictions:
- Ecommerce sales will keep rising; brick-and-mortar retail sales will keep declining. An important factor to consider here is the generational shift. As the “digital native” Generation Z enters the workforce, their spending power will increase, and it’s safe to assume that they will be more inclined to buy online than the previous generations. Meanwhile, millennials will continue climbing the career ladder, which will result in more disposable income. This will also have a positive impact on ecommerce sales.
- Online shopping will get more popular in emerging markets in Africa, Asia, Middle East, and Latin America as these regions become more developed and the spending power of the average person increases.
- Amazon will remain dominant. Other major retailers, such as Walmart, are working hard to establish themselves online. However, when it comes to dethroning Amazon, there’s still no serious contender in sight.
- Conversational commerce will be an essential part of selling online. At the moment, customers are still getting used to being able to contact businesses via messaging apps, but soon they will expect it. And who can blame them? It’s a convenient way to get answers to their questions.
- Chatbots might become the only way to meet people’s expectations when it comes to customer service, since the more businesses adopt them, the more pressure there is on their competitors to do the same.
- Shoppable social media will only become more prevalent. As evidenced by the rollout of shopping for Instagram Stories in the fall of 2018 and the anticipation of the same within Facebook Stories, the days of “link in bio” are very much numbered. Give your followers the chance to act on the inspiration your visual creative instills in them.
In short, ecommerce isn’t going anywhere, but it will continue to evolve, and you will need to adapt to those changes.
In order to do so, you’ll need to keep an eye on the latest ecommerce statistics to stay up-to-date with industry standards. Sure, you can never be certain, but understanding the current trends will help you better prepare for the future.
Want more marketing stats? Check out these 11 Legitimately Scary PPC Stats Every Advertiser Should Know!
Are you wasting money in Google Ads?

Meet The Author
Brad Smith
Brad Smith is the founder of Codeless, long-form content creators for SaaS companies. Their work has been featured in The New York Times, Business Insider, TheNextWeb, Shopify, Moz, Unbounce, HubSpot, Search Engine Journal, and more.
Recommended for you