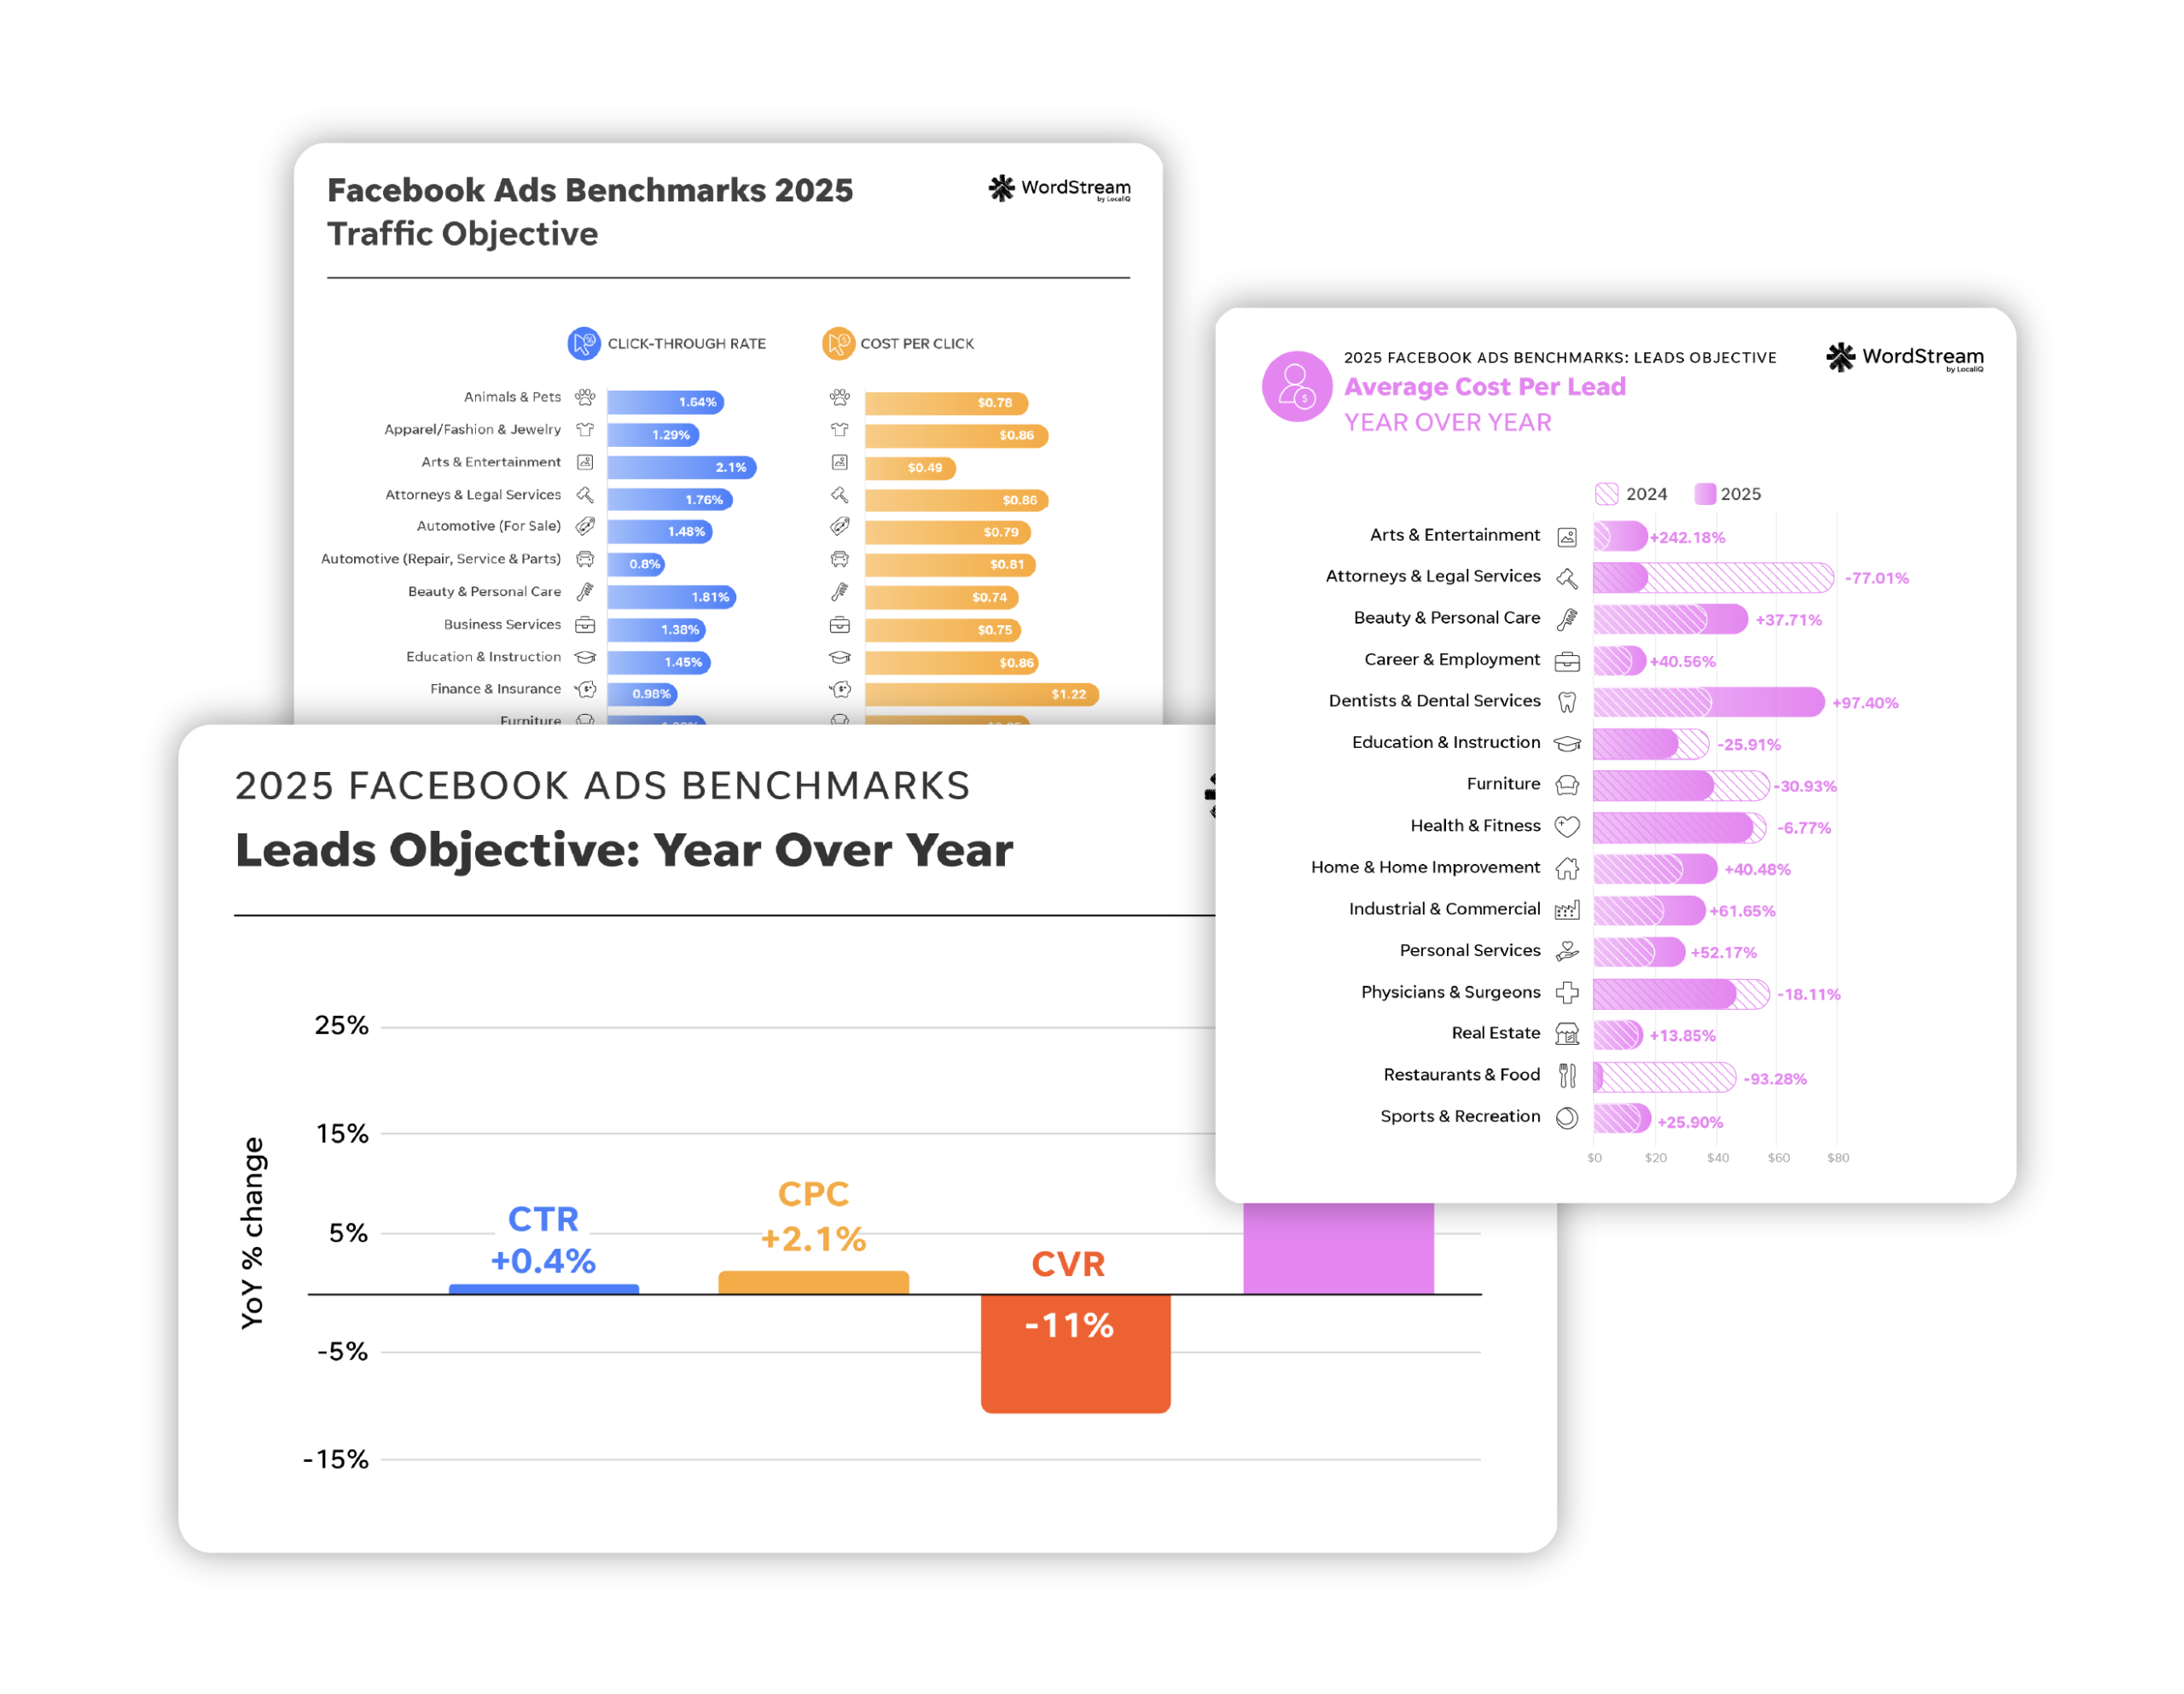
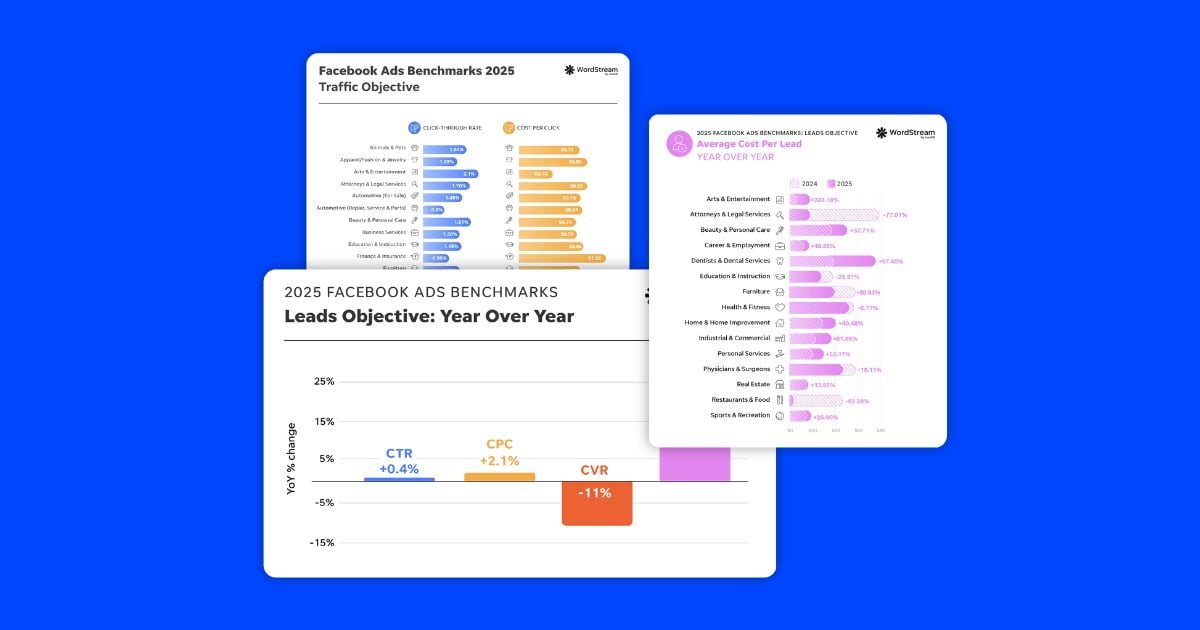
>> Catch our updated Facebook ad benchmarks here!
Facebook is one of the fastest growing ad networks – in fact, the number of advertisers using Facebook has more than doubled in the last 18 months.
If you’re one of the 2 million advertisers who decided to start advertising on Facebook in the past 2 years, you may have found that it can be easy to get overwhelmed on the new platform. Facebook has nearly countless ad targeting options to explore, and performance differs for every client. Just like on Google Ads, performance can differ across different industries on Facebook, so what numbers should you be looking to beat in your industry?
We dug into our data to find out! Check out the Facebook ad performance benchmarks our clients are seeing, including:
- Average Click-Through Rate (CTR) on Facebook by industry
- Average Cost per Click (CPC) on Facebook by industry
- Average Conversion Rate (CVR) on Facebook by industry
- Average Cost per Action (CPA) on Facebook by industry
You’ll find averages across these Facebook metrics for eighteen industries: Apparel, Auto, B2B, Beauty, Consumer Services, Education, Employment & Job Training, Finance & Insurance, Fitness, Home Improvement, Healthcare, Industrial Services, Legal, Real Estate, Retail, Technology, and Travel & Hospitality. Let’s dig in!
Average Click-Through Rate on Facebook
What’s a good click-through rate on Facebook ads?
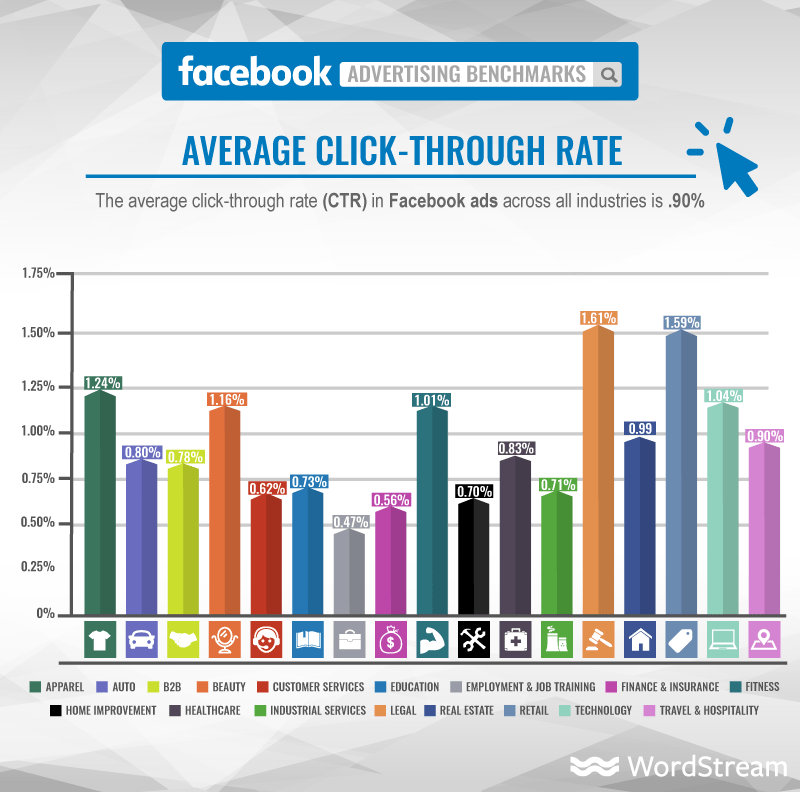
Legal advertisers may struggle with low click-through rates on the SERP, but they’re lucky to have the highest CTRs on Facebook (1.61%). No doubt, it can be hard to impress the prospective client looking for a lawyer when your ad is one among seven ads on the SERP, but a lawyer’s high-value offer and call to action certainly stands out more when it’s standing alone on a prospect’s social feed.
Other advertisers with high CTRs are in the retail (1.59%), apparel (1.24%), beauty (1.16%), and fitness (1.01%) industries. It’s no surprise that these industries often feature models and high-quality images in their ads, and those ads perform particularly well on highly visual platforms like Facebook and Instagram.
You have to be pretty crafty to distract potential job hunters from their social feeds, and employment & job training services can have relatively low CTRs on Facebook (0.47%). Facebook and Instagram may not be the network for job seekers, but LinkedIn may have promise for these advertisers!
The average click-through rate (CTR) for Facebook ads across all industries is 0.90%.
Average Click Through Rate (CTR) for Facebook Ads by Industry
| Industry | Average CTR |
|---|---|
| Apparel | 1.24% |
| Auto | 0.80% |
| B2B | 0.78% |
| Beauty | 1.16% |
| Consumer Services | 0.62% |
| Education | 0.73% |
| Employment & Job Training | 0.47% |
| Finance & Insurance | 0.56% |
| Fitness | 1.01% |
| Home Improvement | 0.70% |
| Healthcare | 0.83% |
| Industrial Services | 0.71% |
| Legal | 1.61% |
| Real Estate | 0.99% |
| Retail | 1.59% |
| Technology | 1.04% |
| Travel & Hospitality | 0.90% |
🚨 Get the latest data to see how you stack up in our newest Facebook Ads Benchmarks Report!
Average Cost Per Click (CPC) on Facebook
What’s a good cost per click for Facebook ads?
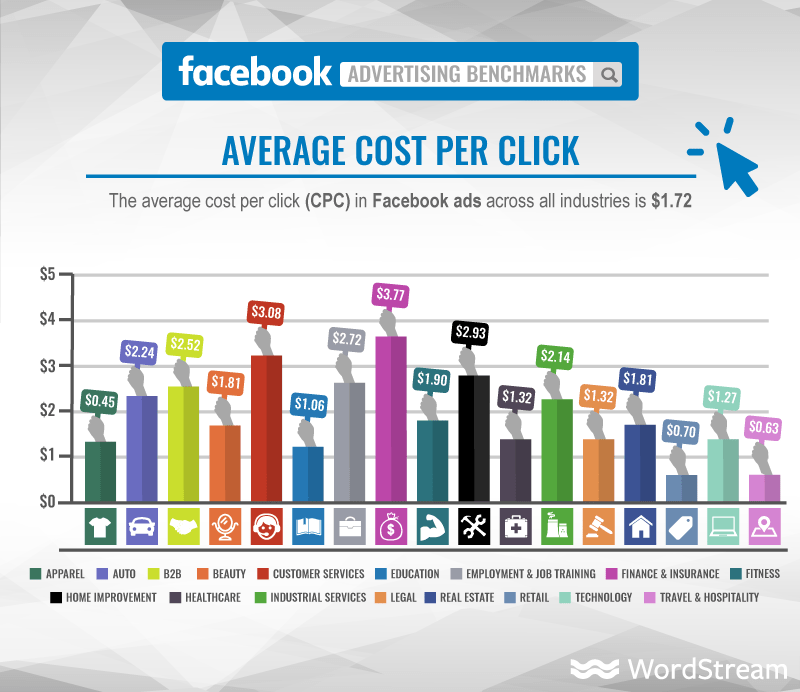
Even though financial advertisers have the highest CPCs on Facebook at $3.77 per click, advertisers may still be quite satisfied with that CPC on Facebook. The terms “Insurance,” “Loans,” and “Mortgage” are the three most expensive keywords on Google, each costing about $50 per click.
The cheapest clicks on Facebook are reserved for the apparel ($0.45 per click), travel and hospitality ($0.63) and other retailers ($0.70) industries, with clicks well below a dollar. These industries often have the largest audiences so even at these low CPCs, it’s important to understand how to manage your budgets so that your Facebook costs don’t run amok.
The average cost per click (CPC) for Facebook ads across all industries is $1.72.
Average Cost Per Click (CPC) for Facebook Ads by Industry
| Industry | Average CPC |
|---|---|
| Apparel | $0.45 |
| Auto | $2.24 |
| B2B | $2.52 |
| Beauty | $1.81 |
| Consumer Services | $3 .08 |
| Education | $1.06 |
| Employment & Job Training | $2.72 |
| Finance & Insurance | $3.77 |
| Fitness | $1.90 |
| Home Improvement | $2.93 |
| Healthcare | $1.32 |
| Industrial Services | $2.14 |
| Legal | $1.32 |
| Real Estate | $1.81 |
| Retail | $0.70 |
| Technology | $1.27 |
| Travel & Hospitality | $0.63 |
🛑 Want to know how your Facebook ads are really performing? Find out with our free Facebook Ads Performance Grader!
Average Conversion Rates on Facebook
What’s a good conversion rate on Facebook ads?
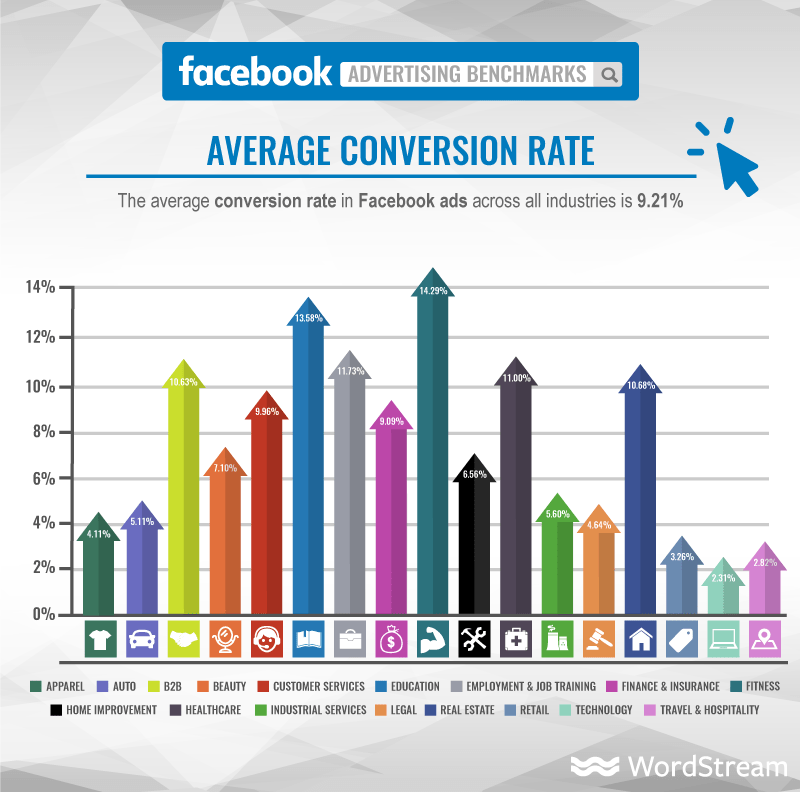
Fitness studios have plenty to sweat about, but finding prospects on Facebook doesn’t appear to be one of them! Facebook can connect driven prospects into the hands of fitness advertisers and help them convert at remarkably high rates, averaging 14.29% conversion rates from Facebook ads.
Other industries with high CVRs are education (13.58%), employment & job training (11.73%), healthcare (11.00%), real estate (10.68%) and B2B (10.63%). Facebook’s unique lead generation ads help these industries outperform most other ad platforms!
However, industries such as retail, travel & hospitality, and technology may not benefit as much from Facebook’s lead generation ads and consequently have much lower conversion rates (3.26%, 2.82%, and 2.31%, respectively). For these advertisers, remarketing on Facebook may be particularly powerful to help improve conversion rates. As it turns out, exposure to remarketing ads can help increase conversion rates over time!
The average conversion rate for Facebook ads across all industries is 9.21%.
Average Conversion Rate (CVR) for Facebook Ads by Industry
| Industry | Average CVR |
|---|---|
| Apparel | 4.11% |
| Auto | 5.11% |
| B2B | 10.63% |
| Beauty | 7.10% |
| Consumer Services | 9.96% |
| Education | 13.58% |
| Employment & Job Training | 11.73% |
| Finance & Insurance | 9.09% |
| Fitness | 14.29% |
| Home Improvement | 6.56% |
| Healthcare | 11.00% |
| Industrial Services | 0.71% |
| Legal | 5.60% |
| Real Estate | 10.68% |
| Retail | 3.26% |
| Technology | 2.31% |
| Travel & Hospitality | 2.82% |
✴️ Running Google Ads too? Download our latest report: Search Advertising Benchmarks for Your Industry
Average Cost Per Action on Facebook
What’s a good CPA on Facebook?
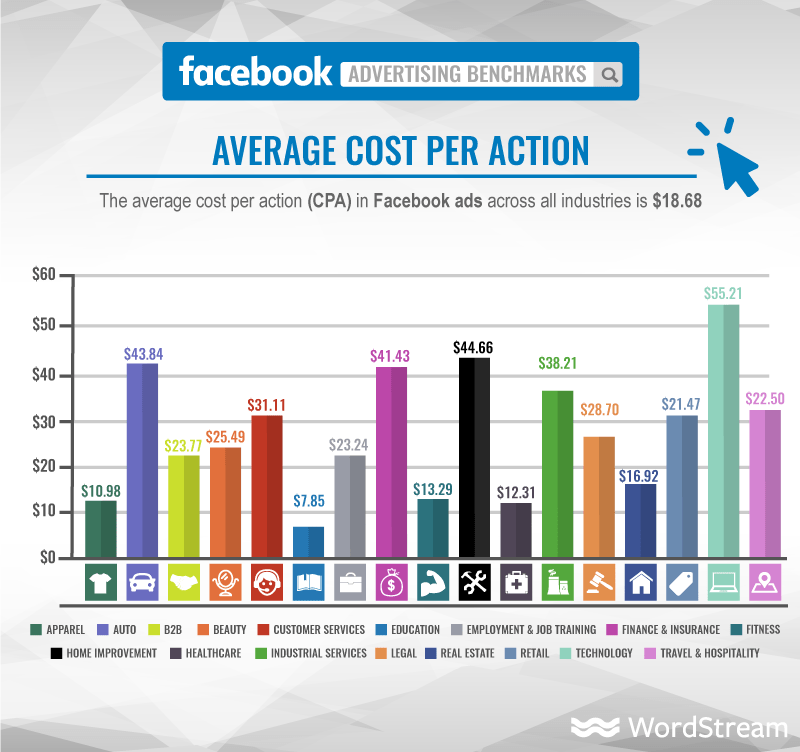
With an average CPA of $7.85, nearly all education advertisers agree that it’s a smart decision to cater to Facebook and Instagram’s relatively young audience. While Facebook may be a great place to find your new students, it can be an expensive place to find a new car, architect, or IT specialist – average Facebook CPAs for auto, home improvement, and technology services are $43.84, $44.66, and $55.21, respectively. Of course, the lifetime value of a new client in these industries is very high, making it all worthwhile in the end.
The average cost per action (CPA) for Facebook ads across all industries is $18.68.
Average Cost Per Action (CPA) for Facebook Ads by Industry
| Industry | Average CPA |
|---|---|
| Apparel | $10.98 |
| Auto | $43.84 |
| B2B | $23.77 |
| Beauty | $25.49 |
| Consumer Services | $31.11 |
| Education | $7.85 |
| Employment & Job Training | $23.24 |
| Finance & Insurance | $41.43 |
| Fitness | $13.29 |
| Home Improvement | $44.66 |
| Healthcare | $12.31 |
| Industrial Services | $38.21 |
| Legal | $28.70 |
| Real Estate | $16.92 |
| Retail | $21.47 |
| Technology | $55.21 |
| Travel & Hospitality | $22.50 |
What Does It All Mean?
Facebook advertising is really taking off because it offers an abundance of opportunity for advertisers of nearly all industries.
If you find yourself on the lower end of these numbers, that just means there’s plenty of room for improvement! To learn how to improve your ads on Facebook, visit PPC University or call us to speak with a Facebook expert today. If you’re hitting these benchmarks – don’t stop and settle for average either! Always strive to be a unicorn by writing the best ad copy and creating landing page unicorns that convert better than anyone else!
You may also be interested in:
- 2021 search advertising benchmarks
- 2021 home services advertising benchmarks
- 2021 real estate advertising benchmarks
- 2021 healthcare advertising benchmarks
Check out the full infographic below:

Hungry for even more Facebook statistics? Check out our collection of 75 fascinating and actionable Facebook stats.
Data Sources
This report is based on a sample of 256 US-based WordStream client accounts in all verticals (representing $553,000 in aggregate Facebook spend) who were advertising on Facebook between November 2016 and January 2017. Facebook campaigns can have several different objectives, so only Facebook campaigns with the objective of driving conversions were considered when determining average CVR and CPA numbers. Average figures are median figures to account for outliers. All currency values are posted in USD.
Frequently Asked Questions (FAQ)
Q: Is there any data available for search advertising?
A: Indeed! Check out our 2022 Search Advertising Benchmarks.
Q: Is there any data available for non-profits?
A: Interestingly, we didn’t see many non-profit advertisers on Facebook (and we looked)! Facebook doesn’t offer the same free advertising grants for non-profits and charities that Google does so we see a lot more non-profits on Google rather than Facebook.
Q: Do you have any benchmarks for Facebook Lead Gen ads?
A: The above benchmarks include all ad types, including Lead Gen ads.
Q: I’m a bit confused by your conversion rate percentage. It seems incredibly high. What are you considering conversions? Was it a form filled out and the FB pixel counted once the submission takes the visitor to a thank you page or is it as simple as a page view?
A: Conversions are measured based on the goals on the advertisers – for some, that may be a sale, providing your contact information, submitting a form, or placing a call.
Q: When you are talking about clicks are you talking about link clicks or all clicks on the ad? In my opinion, it’s vital to differentiate CTR (All) and CTR (Link Click-Through Rate). To make it a little more complex, there are Unique CTRs in Facebook metrics. The percentages can be very different. Of course, every marketer can find out about all of this thanks to Facebook’s Help Center, but since your post is giving averages it should be clear which metric you’re showing us.
A: Here we’re using the Clicks (All) metric for simplicity, which includes link clicks as well as other media engagements, app downloads, lead fill, etc
Q: I was also wondering what’s your definition for Actions? Is it the total number of actions people took that are attributed to the ads? The metric includes any action that was recorded and attributed to the ads which is the sum of engagement actions (such as post reactions or video views), link clicks and conversions (such as website adds to cart or offline purchases).
A: Here we’re using the action metric as defined within Facebook, which is typically conversions, but also includes similar engagements such as lead submissions and app downloads.
Q: Which countries/regions are included in this data?
A: This data is based on US-based advertisers only.
Q: How exactly do you define a conversion and an action in this context?
A: Conversions are measured based on the goals on the advertisers – for some, that may be a sale, providing your contact information, submitting a form, or placing a call.
Q: Wondering if this data includes both prospecting and retargeting ads? We see much higher performance on retargeting, obviously, so these numbers would be higher if you had included both types of campaign.
A: This data here includes all ad targeting types. We see similar great success from remarketing ads on Facebook, so most of our clients use them more than other types of targeting, so data may skew remarketing-heavy above, but it does include everything.
Q: I was just wondering which FB definition you use for CPC. Are you talking about CPC (All) or CPC (Cost per Link Click)?
A: Here we’re looking at CPC (all).
Q: Do you have any data regarding the average cost per impression or CPC for this year?
A: Not yet.
Q: Thanks for sharing your research! Do you happen to have done a similar study for LinkedIn and Bing? I’m looking forward to seeing those too! Thanks again!
A: We do have this data for Bing.
Q: Do you know what the average product price was per industry for those rates? It would be a great help in understanding how to use the data, for instance if a Technology product was based on the average price of a laptop at $1500 and the CPA was $55.21 compared to say Phone charger at $25 with a CA of $55.21.
A: We don’t and that data doesn’t pass through the API, so it would be difficult to get.
Q: I don’t see anywhere which settings for attribution is used? 1-day view and 28-day click? Or? Please share!
A: Yes, the standard Facebook attribution window is used here.
Q: Can you clarify how you are defining the industries or do you have a link to how they are defined?
A: This was done manually since it only included a few hundred clients.
Q: Great post! I would like to know the formulas you used in order to determine the numbers in your charts so I can use the same formulas to calculate on my end.
A: Click through rate= Clicks / Impressions
Cost per click = Cost / Clicks
Conversion rate = Conversions/ Clicks
Cost per Acquisition = Cost/ Conversions
Q: So basically you’re paying $200 for 1 click to a site (1% avg CTR and $2 avg per click) on Facebook… And that doesn’t even factor in conversion ratios. Pretty rough out there.
A: No – a $2 cost per click means that you’d pay $2 to send a visitor to your site.
Q: Why would conversion rate be much much higher than CTR? All contributed by lead ads? 10% average is… I can’t understand.
A: Facebook’s ads can be highly targeted so that you only reach the audiences and demographics you’re most sure will convert on your site. Although CTR and CVR are generally correlated, it’s fine to have an ad with a higher CVR than CTR.
Q: Could you please give some more insight into which brands/companies have you evaluated to arrive at the industry metrics? Are they established brands, startups, large/mid-sized?
A: The companies in this sample were all different sizes but leaning toward small/midsize rather than large established brands.
Q: Is the definition of Action the same for your Facebook and Google Benchmark study? If so, should I say that ROI on Facebook seems to be much better than on Google for most of the sectors when measured by CPA? Thanks.
A: Yes! Many of our clients find success on both networks 🙂
Q: Have you done any comparisons with Google Ads?
A: Indeed! Here you go.
Q: Does this data reflect ads that were only placed on Facebook (newsfeed, desktop right column, instant articles) or does this also include ads placed through Facebook on Instagram and the Audience Network?
A: The data here is reflective only of those on Facebook and the Facebook app and does not include Instagram or the Audience network.

