Meta Ads is right up there with Google Ads and Microsoft Ads when it comes to the pillar ad publishers businesses are taking advantage of. In fact, over 90% of small businesses we surveyed in our small business trends report said they use Facebook for marketing and advertising.
But running ads via Meta Business Suite to reach audiences on apps like Facebook, Instagram, WhatsApp, and Messenger can be as confusing as it is rewarding.
If you’ve ever questioned whether the numbers you’re looking at in the Meta Ads dashboard are good or bad, we’ve got the data to guide you. It’s all here in this report of over 1,800 Facebook ad campaigns running over the last year.
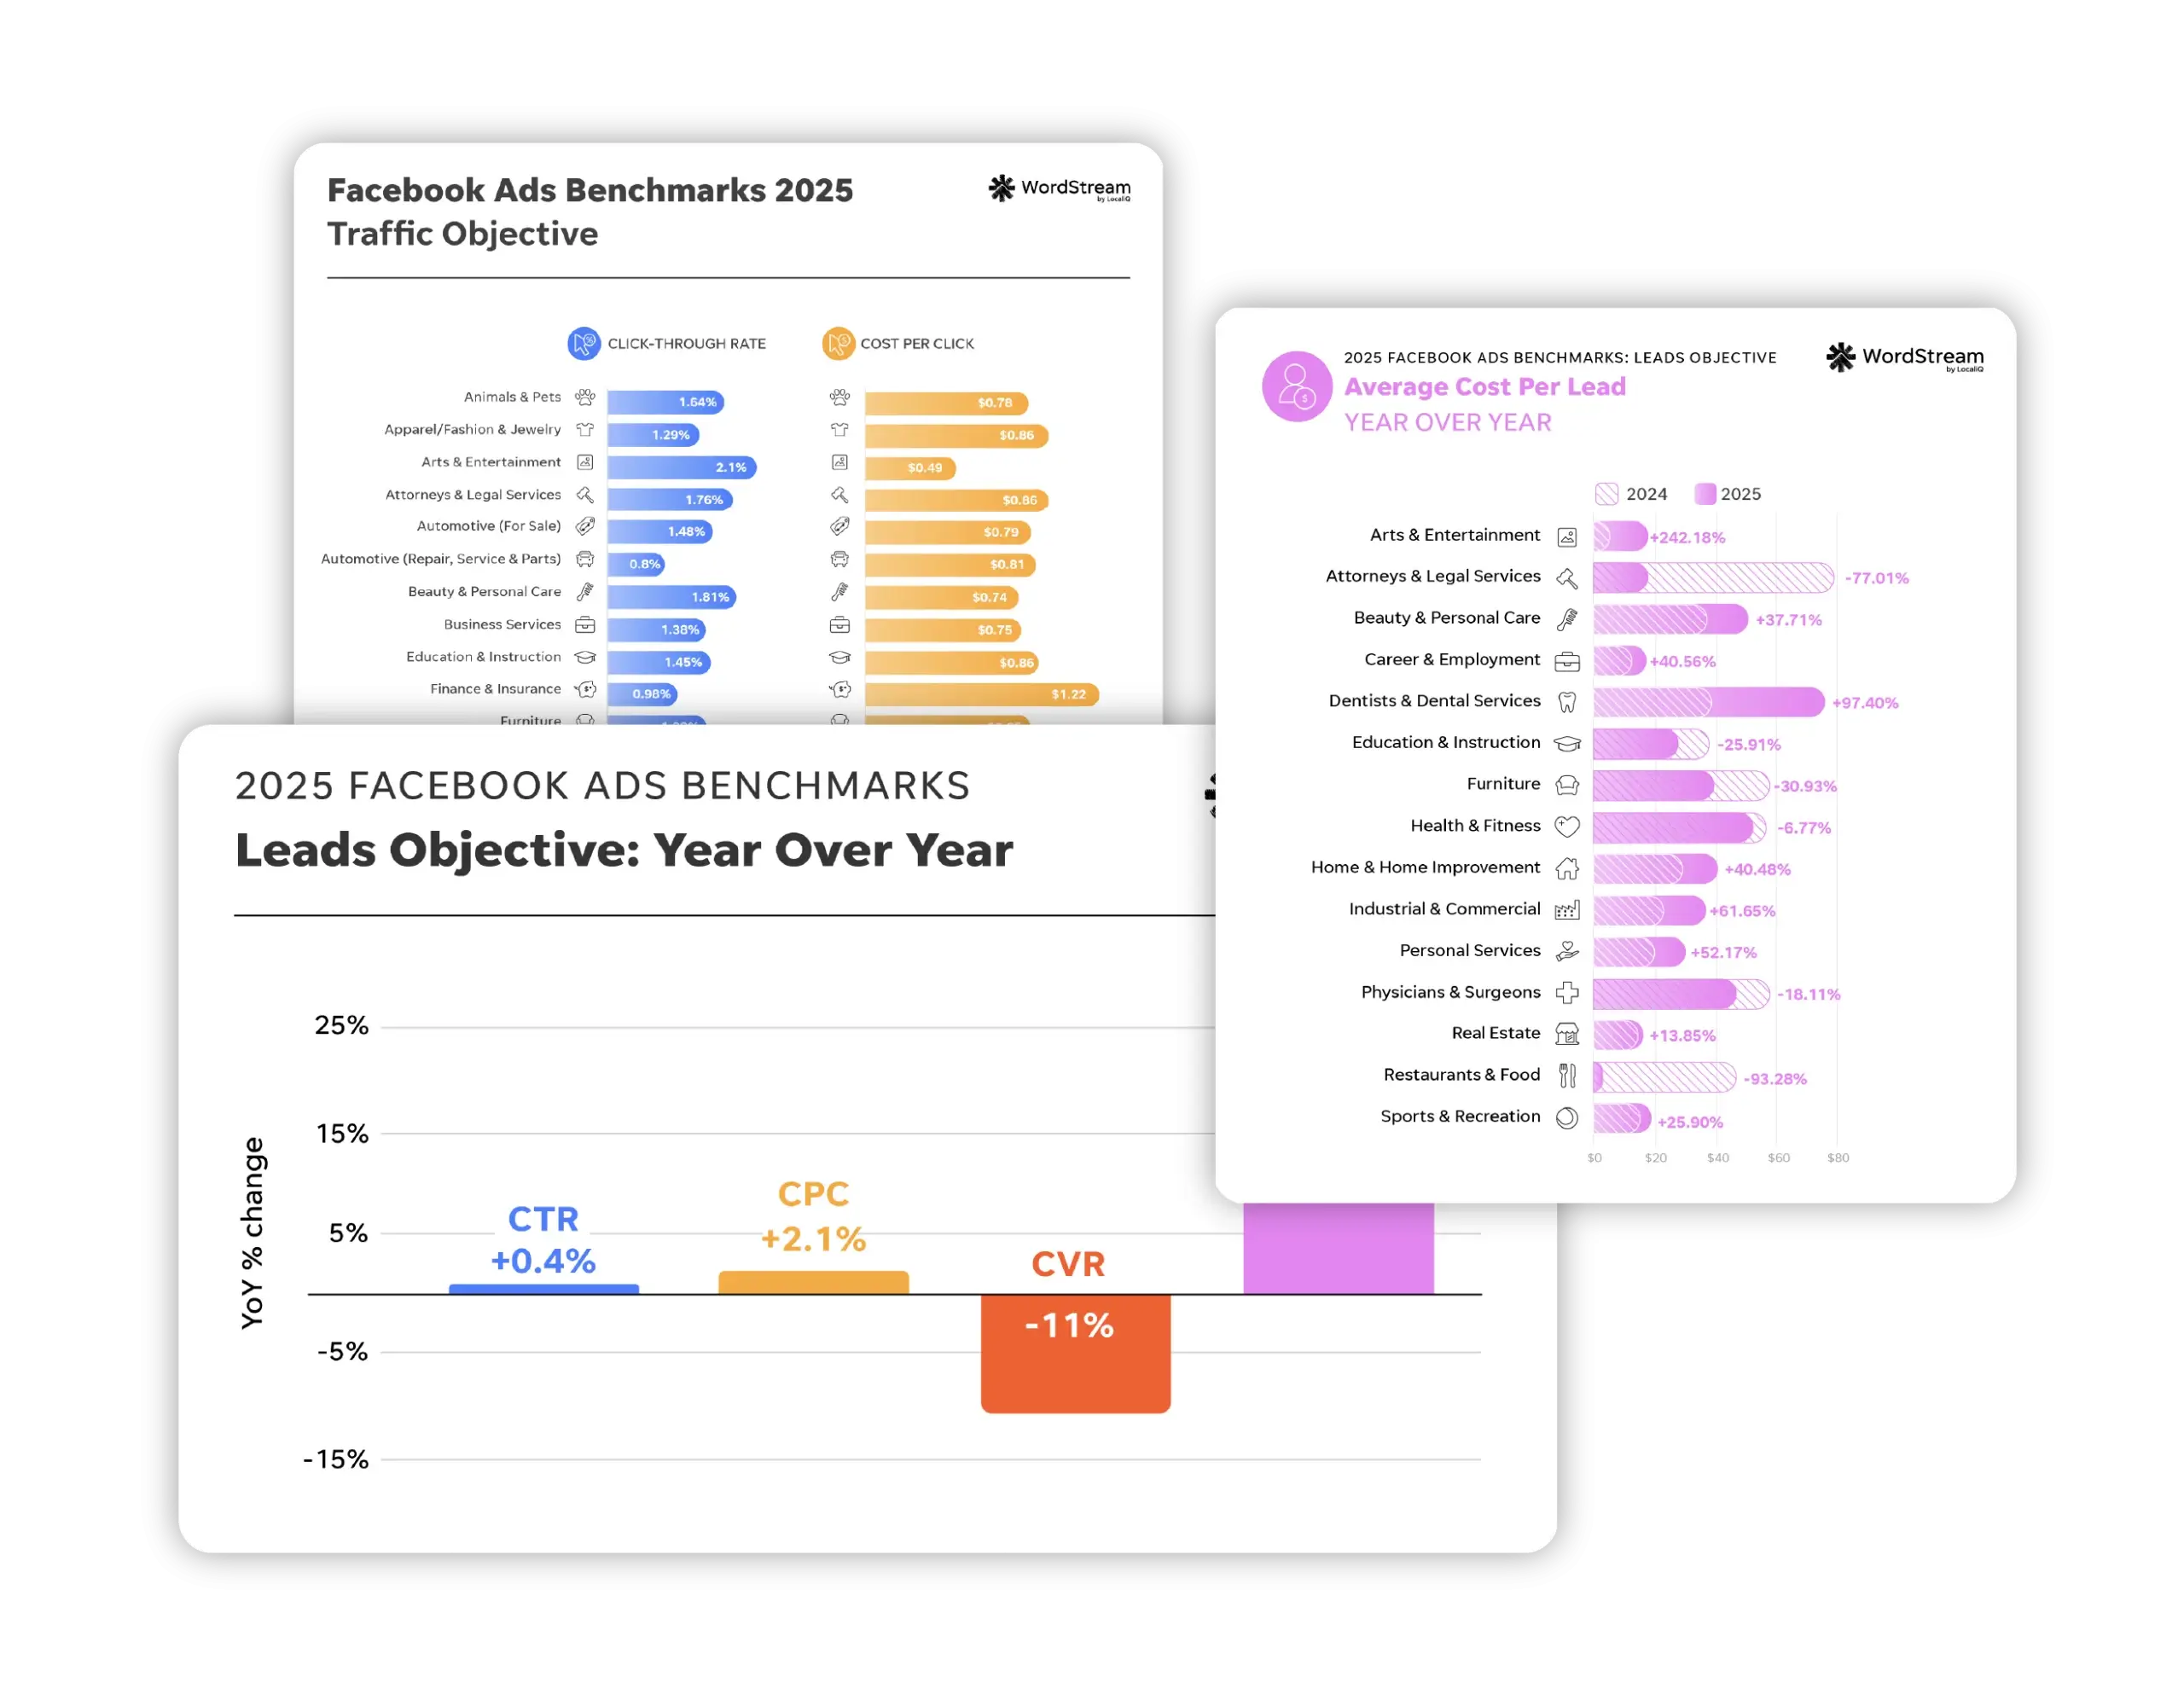
We looked at performance averages by industry for four key Facebook advertising metrics: click-through rate, cost per click, conversion rate, and cost per lead. The data is broken out by two different core Facebook ads campaign objectives (traffic and leads).
This exclusive data enables you to benchmark your own results and see where you can improve. Plus, our expert insights will guide you through the tweaks you need to make to drive the best results from your Meta Ads campaigns so you beat the competition.
Contents
- Key takeaways: the big picture
- Facebook ads benchmarks: Traffic campaigns
- Facebook ads benchmarks: Leads campaigns
- How to improve your Facebook ads results
Key Facebook ads trends: The big picture
Despite rising advertising costs, Facebook ads continue to maintain a cost advantage over Google Ads, making Facebook ads an important part of an overall digital strategy.
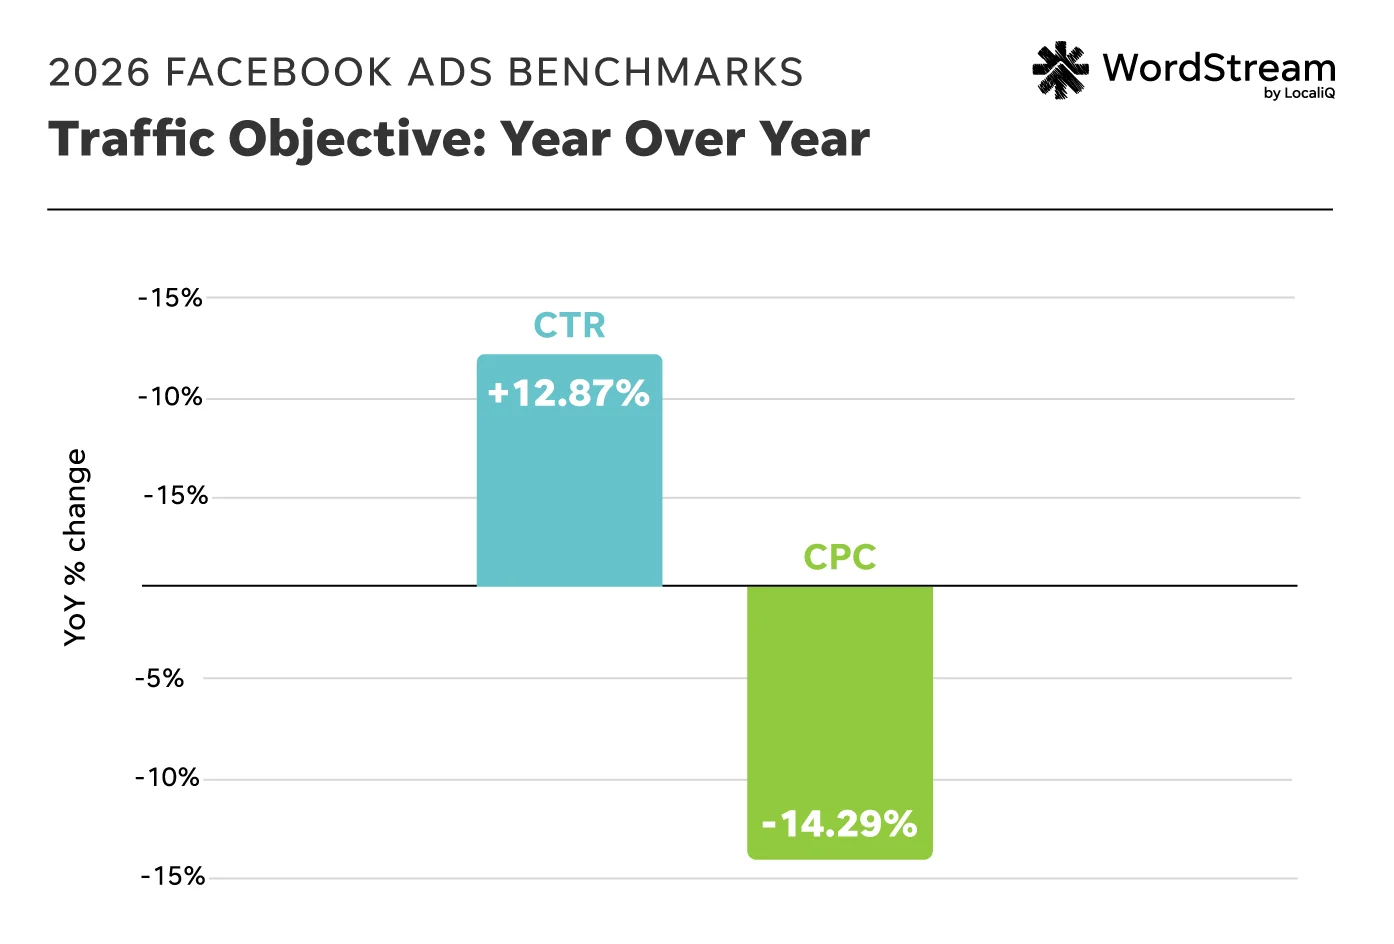
Facebook ads with a traffic objective saw strong improvement year over year, with both higher CTRs and lower CPCs compared to 2025.
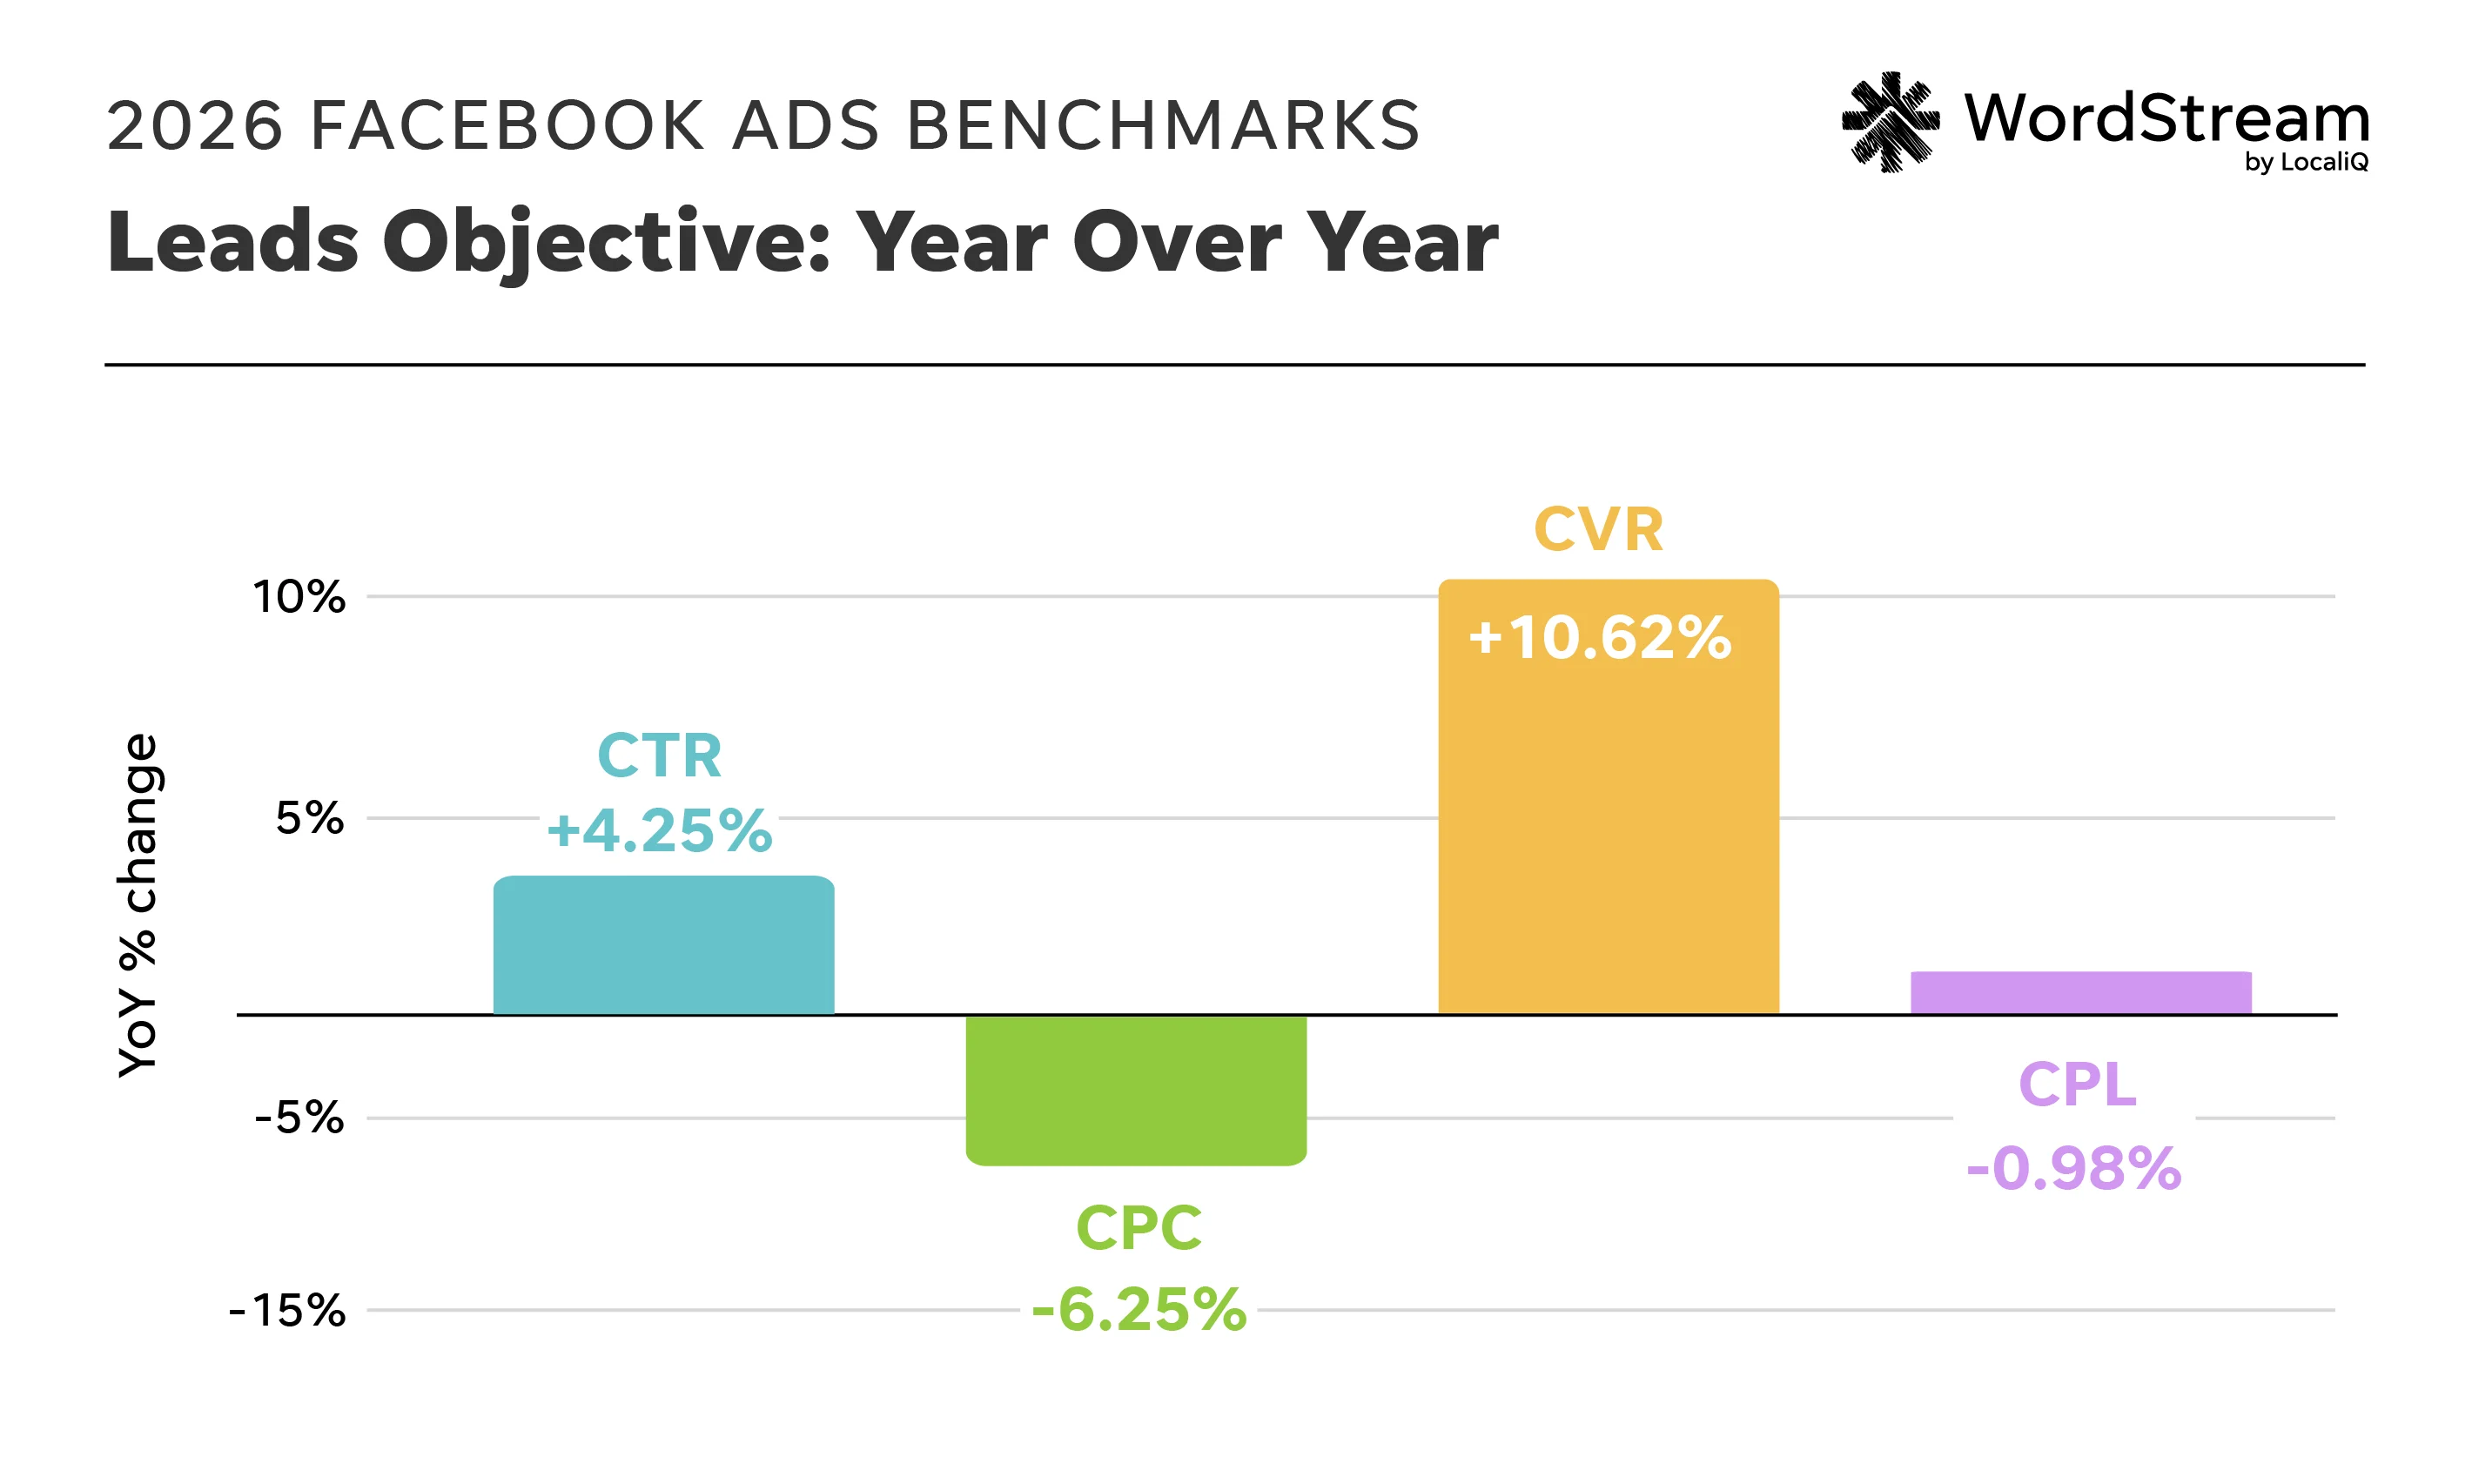
Facebook leads saw performance improvements after a slight decline last year, with an almost 11% increase in CVR, a 6.25% decrease in CPC, and a slight decrease in CPL (only down 1%, roughly).
Google Ads CPC is more than double the average Meta CPC. Google Ads may have more buying intent, but this is still a substantial win for Meta in terms of cost. It’s not that one channel is better than the other; it’s that they are complementary to one another. You can use Meta Ads to supplement your Google Ads campaigns and stretch your budget further.
Experts have noticed that Meta has been improving the bidding and optimization capabilities of campaign objectives such as the leads objective, so naturally, advertisers may be seeing increases in conversions and decreases in cost.
“These results align with what I’ve been seeing: Meta continues to be a cost-effective channel for both traffic and lead generation, especially as part of a broader digital strategy,” said Kendall Cagle, Product Manager—Social & Display Media at LocaliQ.
“Performance will always vary by vertical, audience, creative, and offer, but the year-over-year improvements in CTR, CPC, and lead conversion reinforce that Meta still deliver efficient results when campaigns are set up and optimized well.”
🏃 Want to take this data to go? Download our free 2026 Facebook ads benchmarks report here!
Facebook ads benchmarks for traffic campaigns by industry
Meta’s traffic objective for advertising campaigns acts like the “maximize clicks” bidding strategy on Google Ads. It’s focused on using your budget to serve your ads in a way that’s most likely to drive the highest volume of traffic to your website.
Most businesses consider traffic campaigns a staple part of their Meta Ads strategy since this objective shows your ads to audience members most likely to click off to your website, which helps move potential customers through your funnel.
Average click-through rate for traffic campaigns
Click-through rate is a no-brainer metric for measuring campaigns using the traffic objective in Facebook Ads, since their purpose is to drive clicks. A traffic objective Facebook ads campaign with a high click-through rate is a healthy one.
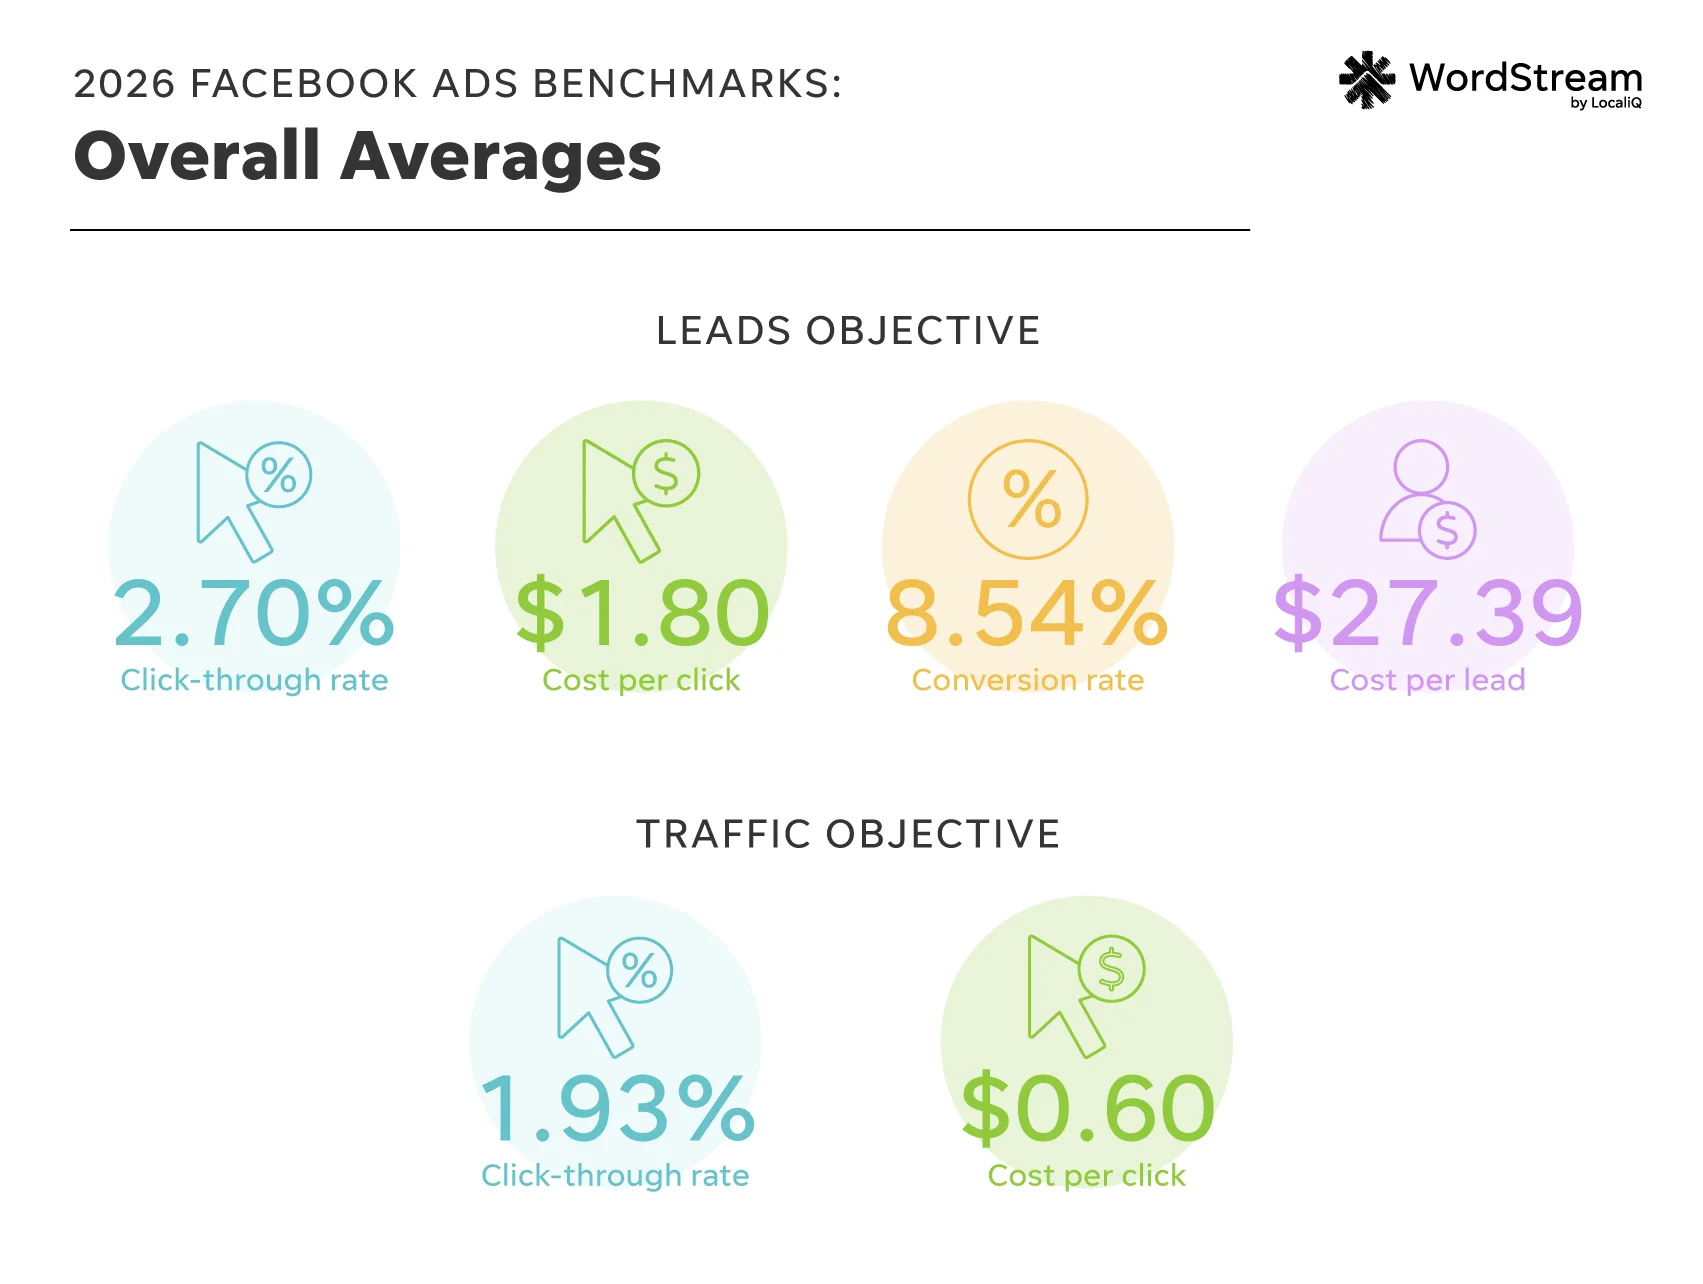
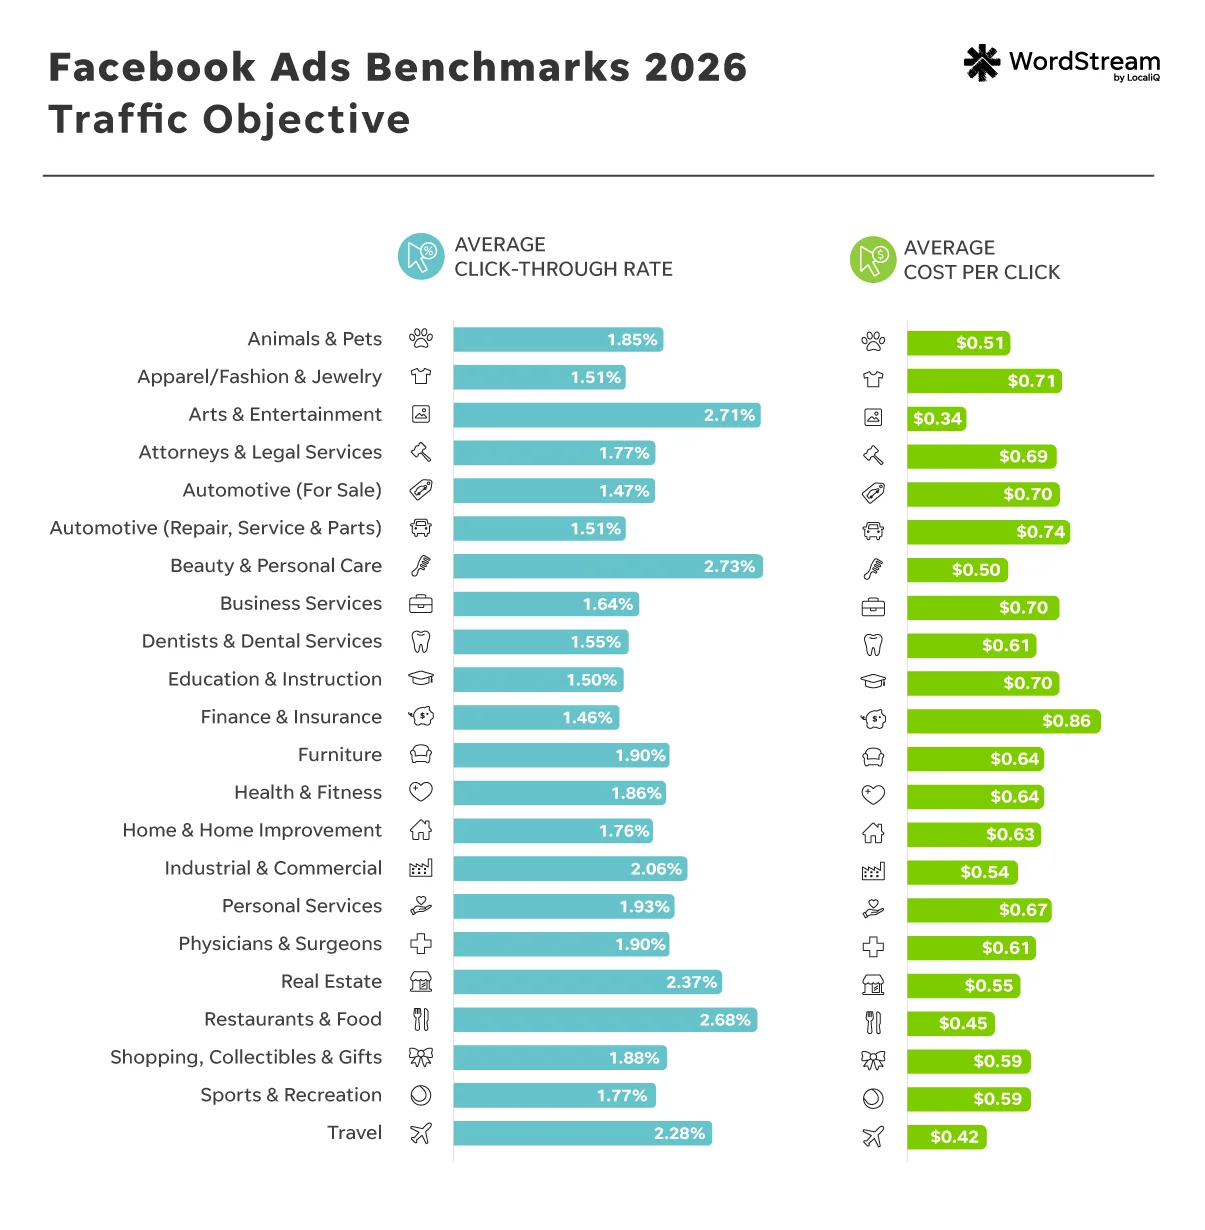
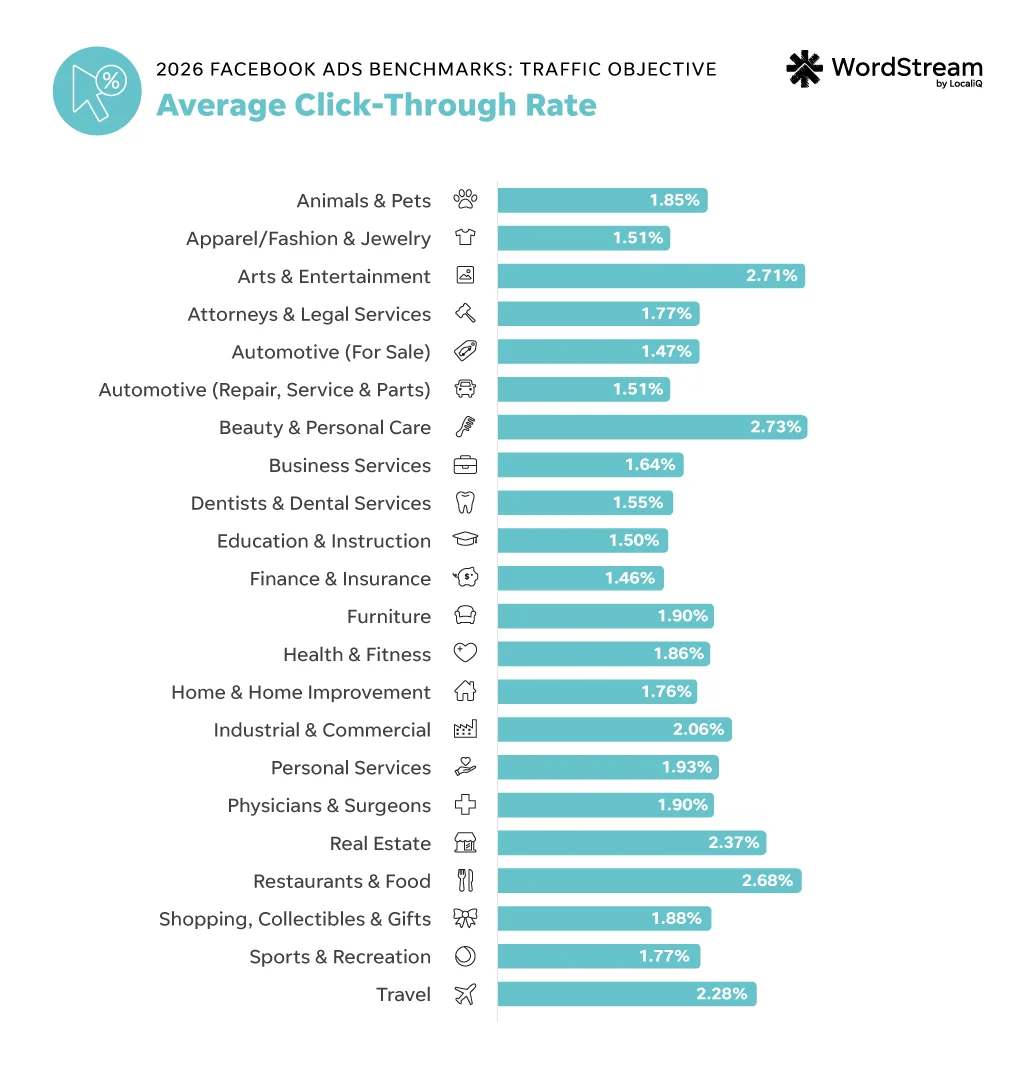
The average click-through rate in Facebook ads for traffic campaigns across all industries is 1.93%.
This is a 12.87% increase compared to last year’s average of 1.71%.
| Business category | Average click-through rate |
| Animals & Pets | 1.85% |
| Apparel / Fashion & Jewelry | 1.51% |
| Arts & Entertainment | 2.71% |
| Attorneys & Legal Services | 1.77% |
| Automotive — For Sale | 1.47% |
| Automotive — Repair, Service & Parts | 1.51% |
| Beauty & Personal Care | 2.73% |
| Business Services | 1.64% |
| Dentists & Dental Services | 1.55% |
| Education & Instruction | 1.50% |
| Finance & Insurance | 1.46% |
| Furniture | 1.90% |
| Health & Fitness | 1.86% |
| Home & Home Improvement | 1.76% |
| Industrial & Commercial | 2.06% |
| Personal Services | 1.93% |
| Physicians & Surgeons | 1.90% |
| Real Estate | 2.37% |
| Restaurants & Food | 2.68% |
| Shopping, Collectibles & Gifts | 1.88% |
| Sports & Recreation | 1.77% |
| Travel | 2.28% |
The industries that had the highest traffic campaign CTRs were Beauty and Personal Care (2.73%), Arts and Entertainment (2.71%), and Restaurants and Food (2.68%).
The industries with the lowest traffic campaign CTRs were Finance and Insurance (1.46%), Automotive—For Sale (1.47%), and Education and Instruction (1.50%).
🚨 Ready to see better Meta Ads results? Start with a free, instant account audit using our Facebook Ads Grader!
Average click-through rate: YoY
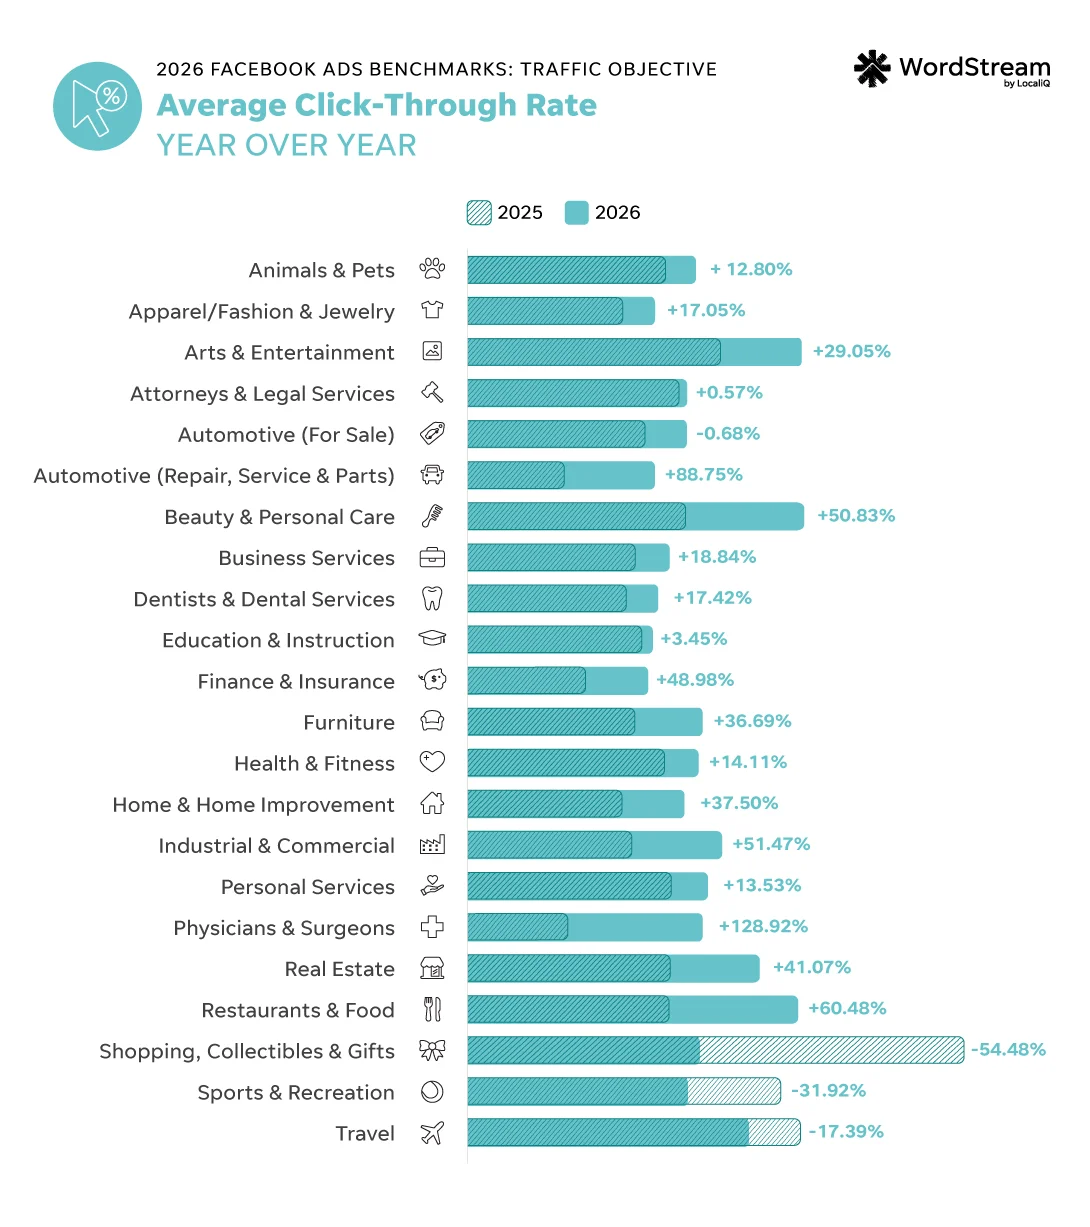
While overall average click-through rate for Facebook traffic campaigns increased for the majority of industries, there were also still a few industries that saw CTR decreases year over year.
For example, the industries with the biggest decreases in click-through rate for traffic campaigns year over year were Shopping, Collectibles, and Gifts (down 54.48%), Sports and Recreation (down 31.92%), and Travel (down 17.39%).
Meanwhile, the industries with the biggest increases in CTR for traffic campaigns year over year were Physicians and Surgeons (up 128.92%), Automotive—Repair, Service, and Parts (up 88.75%), and Restaurants and Food (up 60.48%).
New vehicle sales in the US have been down slightly, which Cox Automotive attributes to inflation and market fragmentation. Accordingly, consumers may be more focused on repairing or maintaining their current vehicles, which could explain why the Repair, Service, and Parts category saw performance increases in click-through rate year-over-year.
Average cost per click for traffic campaigns
Now you might have a high click-through rate for your Facebook traffic campaigns, but if you also have a high cost per click, you’ll still have a problem because an increase in costly clicks will eat your budget faster. That’s why most businesses prioritize average CPC when evaluating traffic campaign performance in Meta Ads.
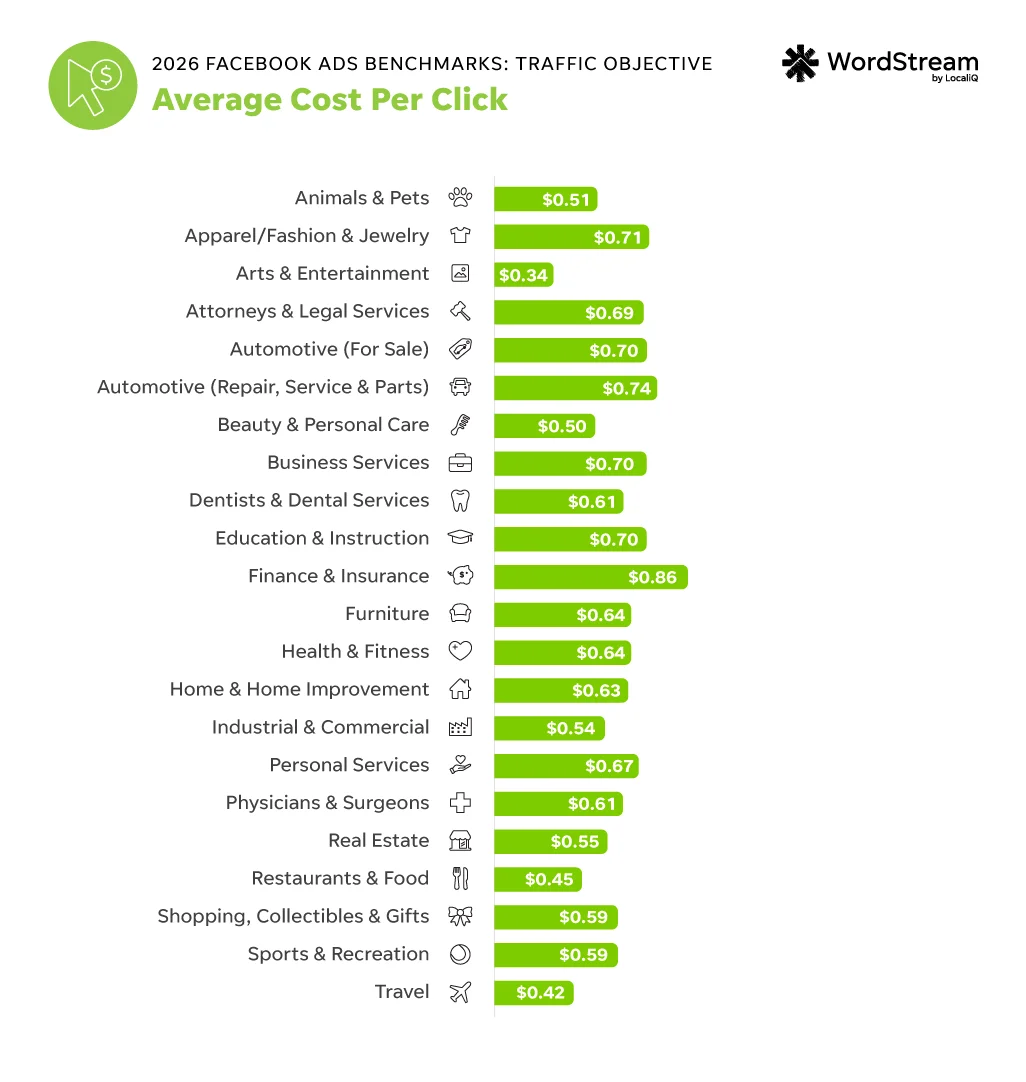
The average cost per click in Facebook ads for traffic campaigns across all industries is $0.60.
This is 14.29% lower than last year’s average of $0.70.
| Business category | Average cost per click |
| Animals & Pets | $0.51 |
| Apparel / Fashion & Jewelry | $0.71 |
| Arts & Entertainment | $0.34 |
| Attorneys & Legal Services | $0.69 |
| Automotive — For Sale | $0.70 |
| Automotive — Repair, Service & Parts | $0.74 |
| Beauty & Personal Care | $0.50 |
| Business Services | $0.70 |
| Dentists & Dental Services | $0.61 |
| Education & Instruction | $0.70 |
| Finance & Insurance | $0.86 |
| Furniture | $0.64 |
| Health & Fitness | $0.64 |
| Home & Home Improvement | $0.63 |
| Industrial & Commercial | $0.54 |
| Personal Services | $0.67 |
| Physicians & Surgeons | $0.61 |
| Real Estate | $0.55 |
| Restaurants & Food | $0.45 |
| Shopping, Collectibles & Gifts | $0.59 |
| Sports & Recreation | $0.59 |
| Travel | $0.42 |
The industries with the lowest CPCs in Facebook ads for traffic campaigns included Arts and Entertainment at $0.34, Travel at $0.42, and Restaurants and Food at $0.45.
In contrast, the industries with the highest CPCs in Facebook ads for traffic campaigns included Finance and Insurance at $0.86, Automotive—Repair, Service, and Parts at $0.74, and Apparel, Fashion, and Jewelry at $0.71.
You can learn how to lower your cost per click in Meta Ads here.
Average cost per click: YoY
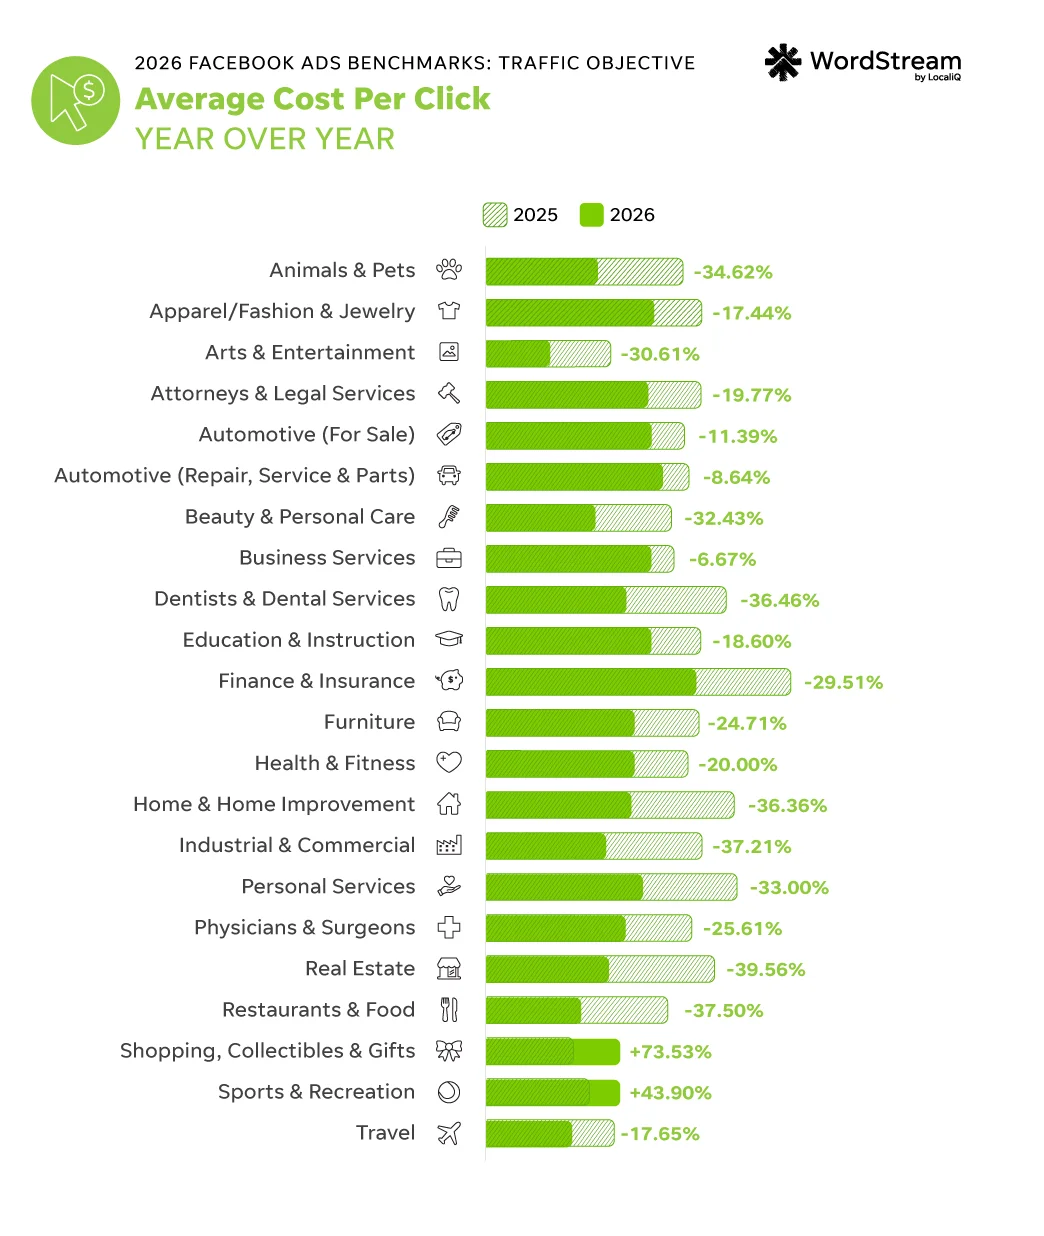
As overall average click-through rate for traffic campaigns improved year over year for the majority of industries, so did cost per click.
Only two industries saw an increase in their traffic CPCs compared to last year: Shopping, Collectibles, and Gifts with a 73.53% increase, and Sports and Recreation with a 43.90% increase.
On the opposite end, the industries with the biggest improvements to their traffic CPCs year over year were Real Estate with a 39.56% decrease, Restaurants and Food with a 37.50% decrease, as well as Industrial and Commercial with a 37.21% decrease.
Facebook ads benchmarks for leads campaigns by industry
The leads objective is a bread-and-butter strategy for many Meta advertisers. It connects directly back to your business’s bottom line, as it encourages campaign behavior to serve ads to users most likely to convert.
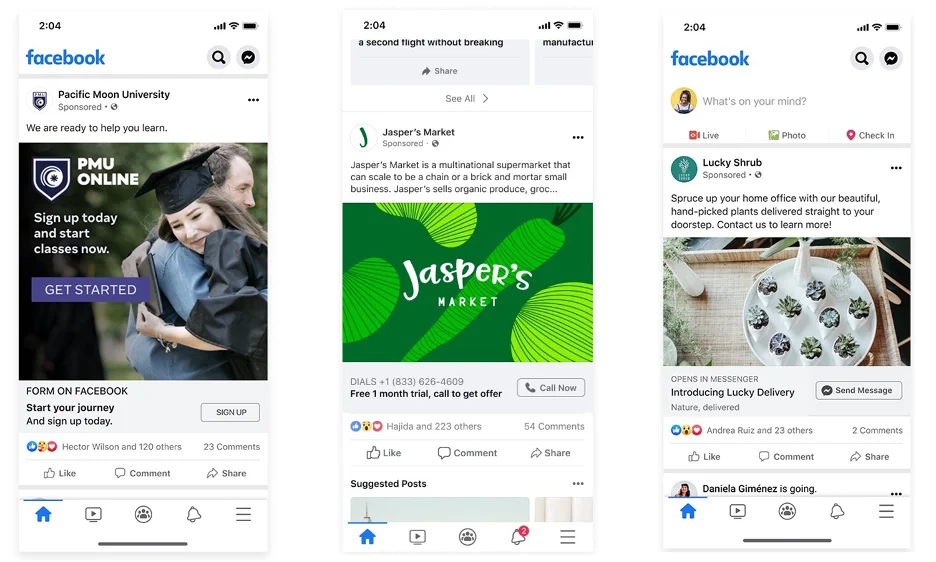
For businesses looking to generate leads, rather than increase sales, the Facebook leads campaign objective is a must-have. That’s partially because of how it influences campaign behavior for the most leads possible, but also because it enables businesses to take advantage of Facebook Lead Ads—which are a special ad format that allows advertisers to build a widely customizable contact form right into their ad that viewers can convert off of without ever having to leave Meta apps.
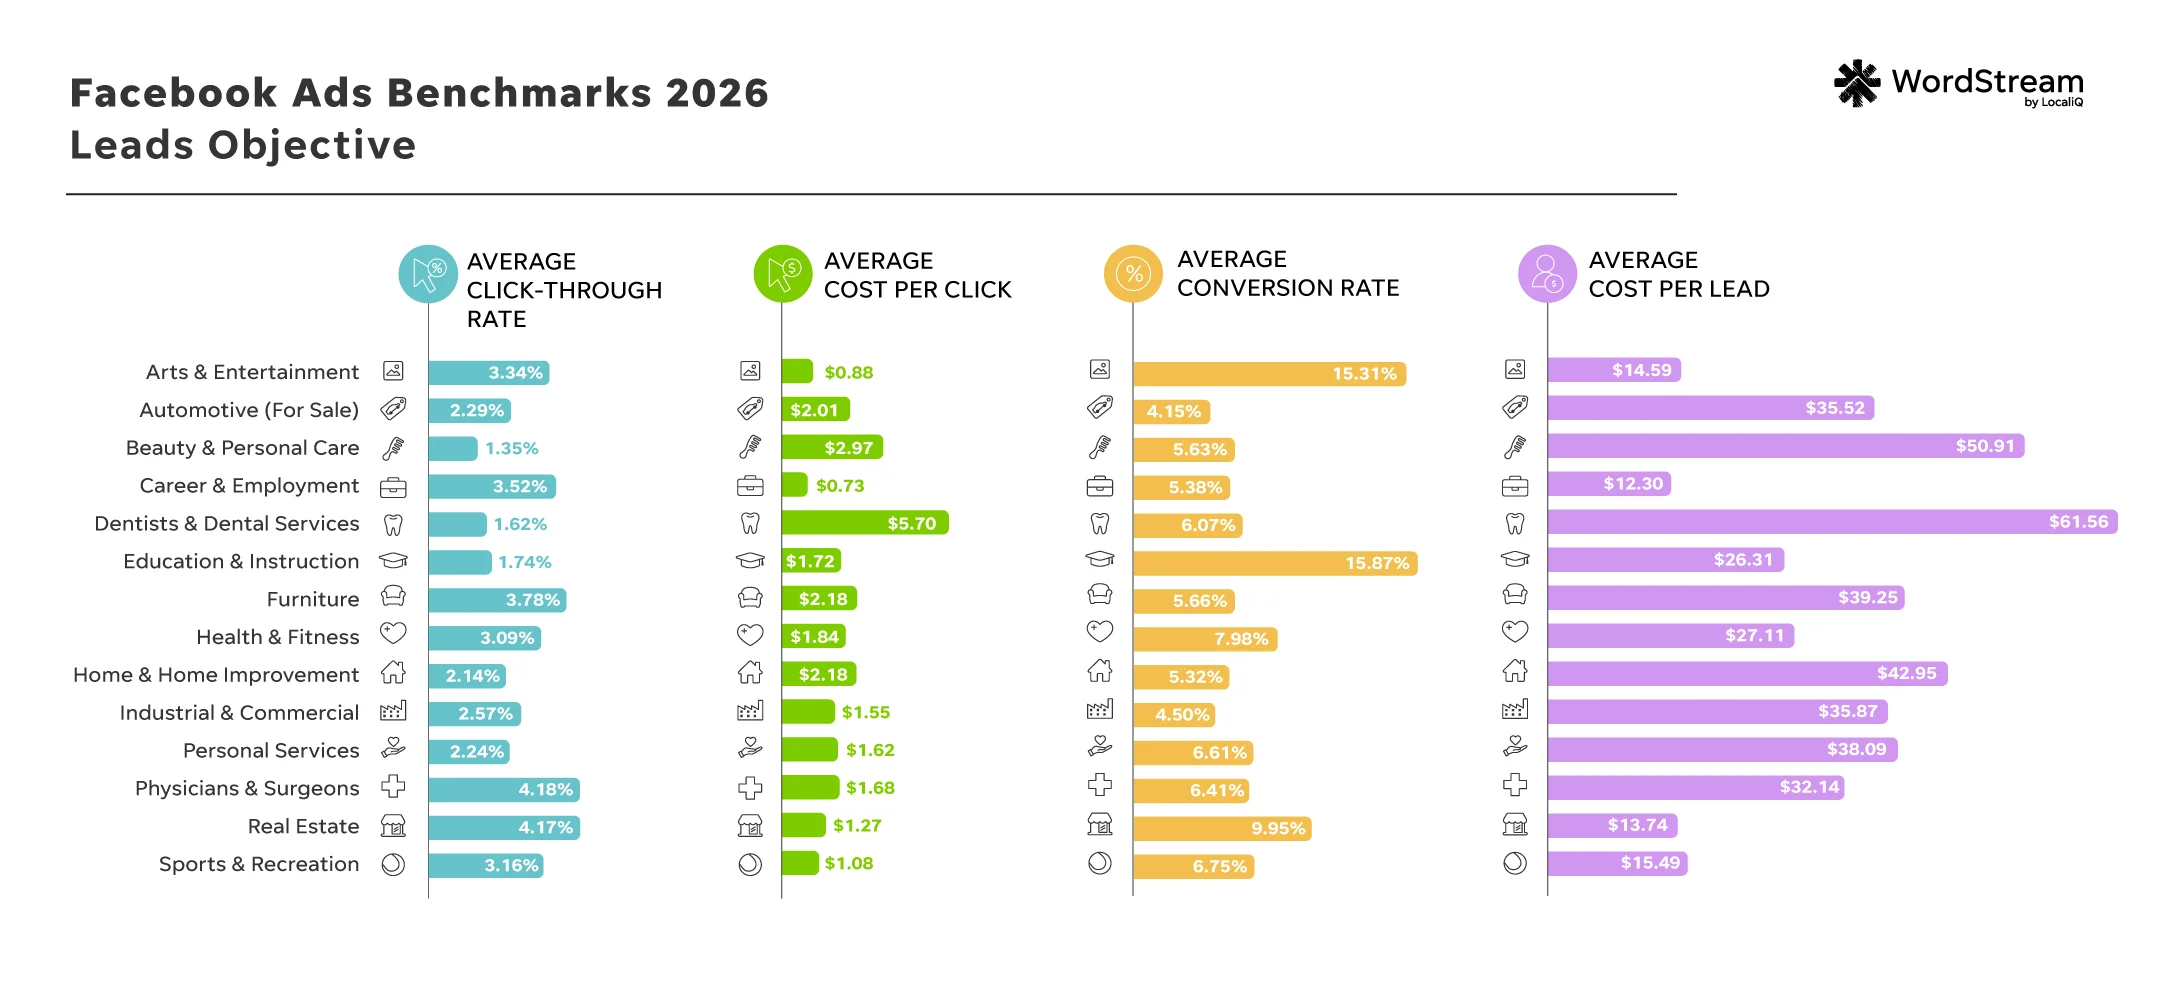
“This year, we saw lead campaigns improve CTR, CPC, and CVR while keeping CPL essentially flat. That tells me advertisers are getting more engagement and stronger conversion efficiency without a meaningful increase in lead cost,” Kendall said.
Average click-through rate for leads campaigns
Although the primary focus of Facebook leads campaigns is, well, leads, click-through rate is still an impactful metric to look at when evaluating your performance. You still need your Facebook Lead Ads to be enticing and “clickable” to get users to your coveted lead form. After all, clicks are the first step to turning potential customers into leads.
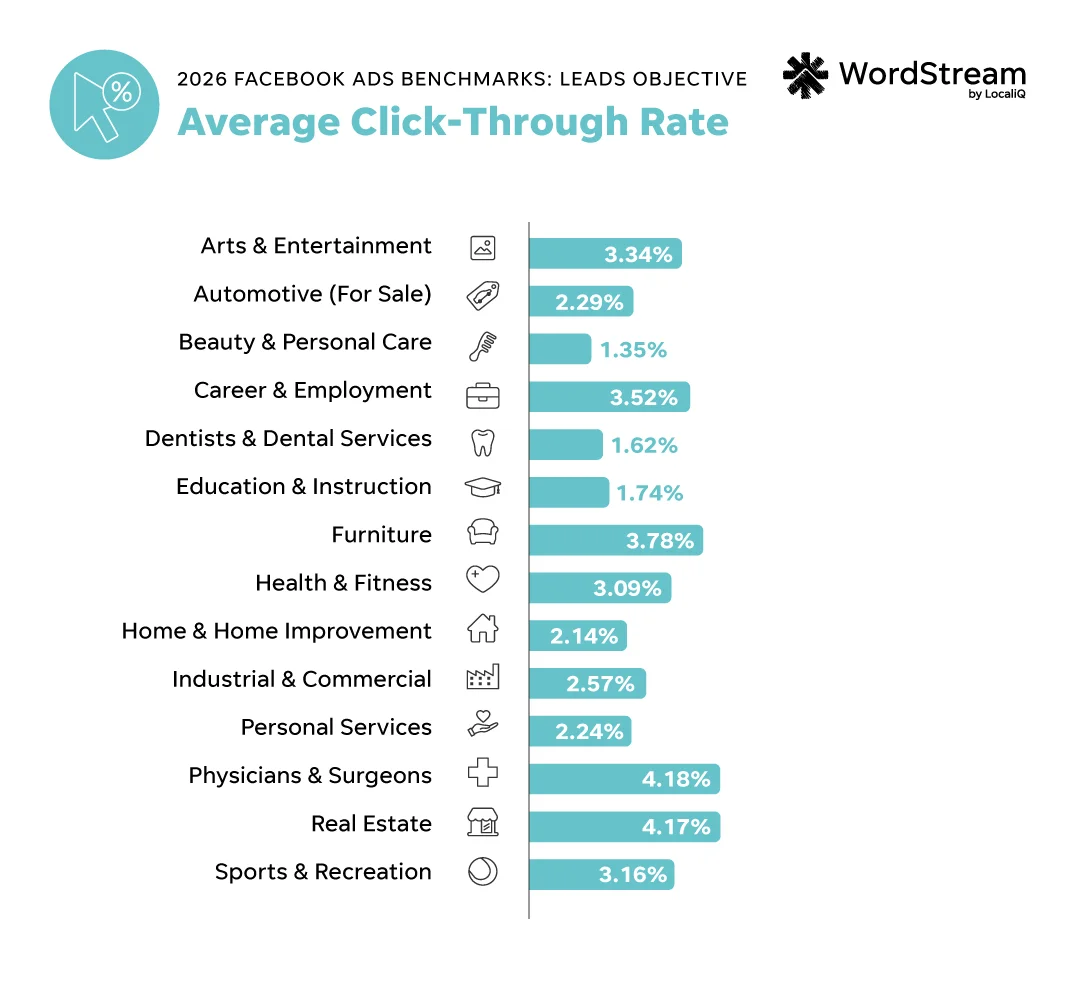
The 2026 average click-through rate in Facebook ads for leads campaigns across all industries is 2.70%.
This is a 4.25% increase compared to last year’s average of 2.59%.
| Business category | Average click-through rate |
| Arts & Entertainment | 3.34% |
| Automotive — For Sale | 2.29% |
| Beauty & Personal Care | 1.35% |
| Career & Employment | 3.52% |
| Dentists & Dental Services | 1.62% |
| Education & Instruction | 1.74% |
| Furniture | 3.78% |
| Health & Fitness | 3.09% |
| Home & Home Improvement | 2.14% |
| Industrial & Commercial | 2.57% |
| Personal Services | 2.24% |
| Physicians & Surgeons | 4.18% |
| Real Estate | 4.17% |
| Sports & Recreation | 3.16% |
The industry with the highest CTR for Facebook leads campaigns this year was Physicians and Surgeons at 4.18%. That industry was followed by Real Estate at 4.17% and Furniture at 3.78%.
The industry with the lowest CTR for Facebook leads campaigns was Beauty and Personal Care at 1.35%, followed by Dentists and Dental Services at 1.62% and Education and Instruction at 1.74%.
Average click-through rate: YoY
The industries with the biggest drops in performance in terms of leads campaign average CTR year over year were Beautify and Personal Care (down 47.06%), Arts and Entertainment (down 14.80%), and Sports and Recreation (down 7.33%).
The industries with the biggest improvements in performance for leads campaign average CTR year over year were Furniture (up 155.42%), Health and Fitness (up 79.65%), and Dentists and Dental Services (up 54.29%).
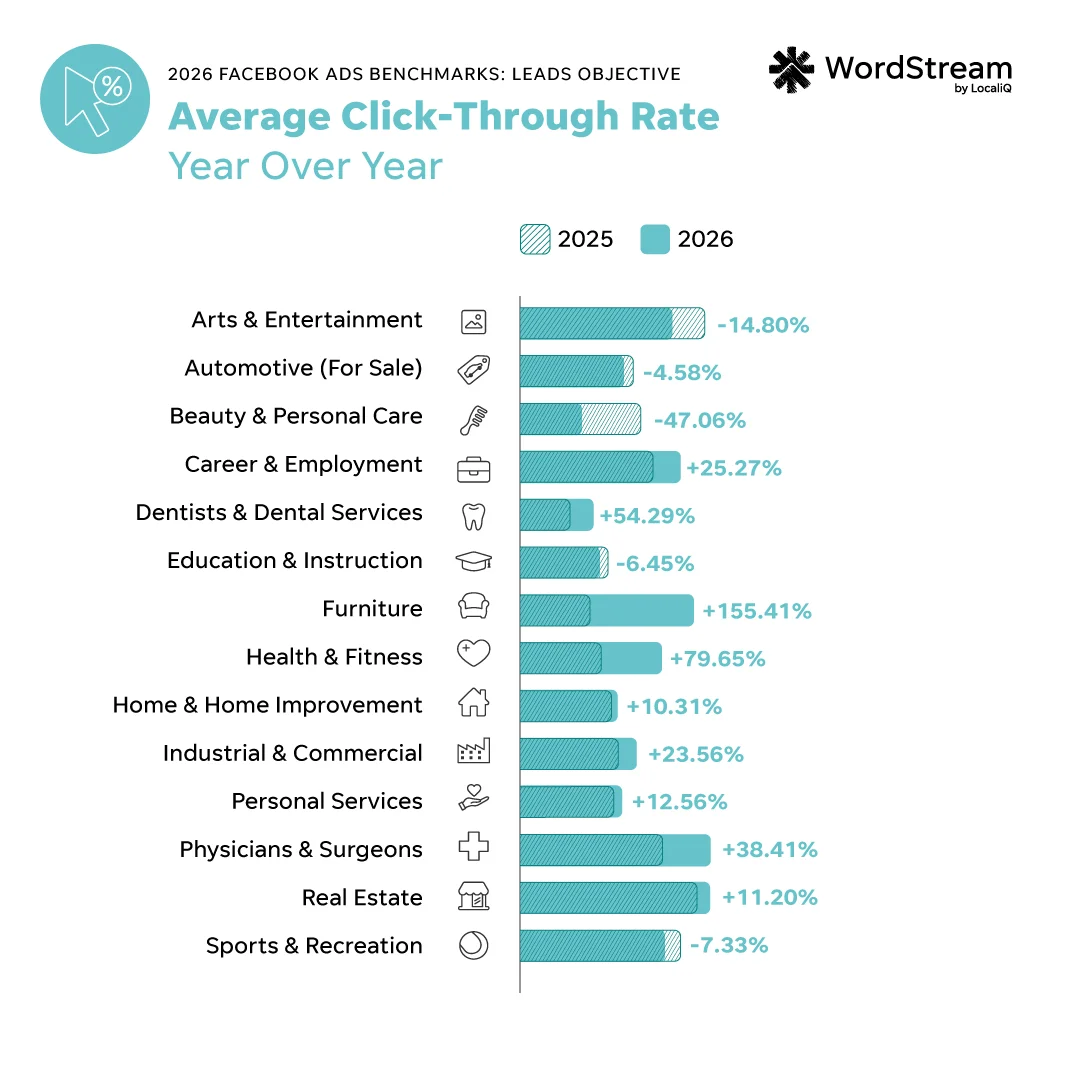
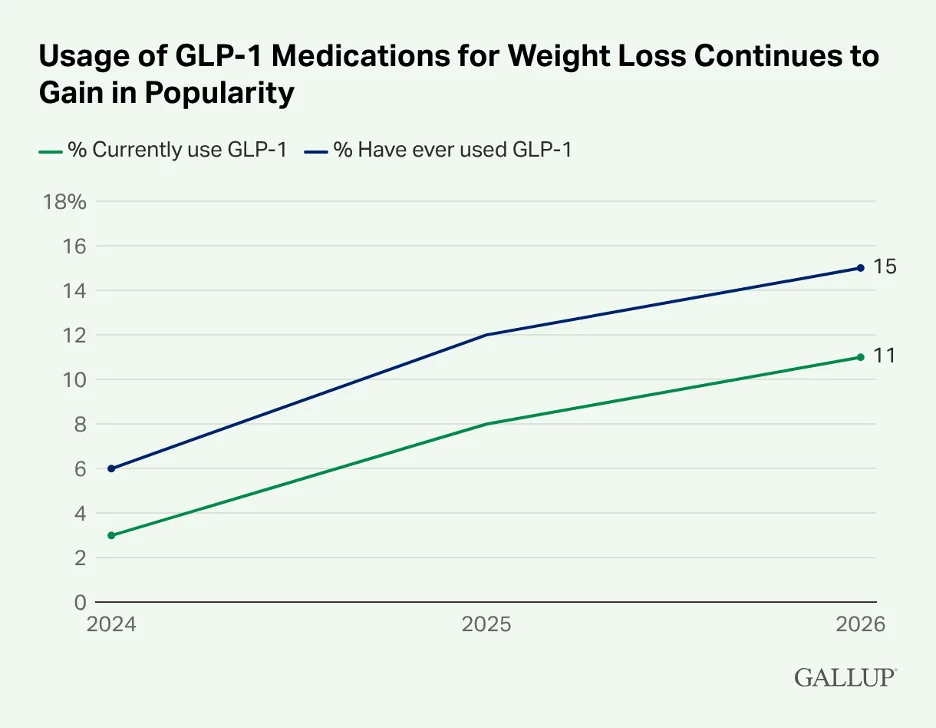
It’s interesting that the Health and Fitness and Physicians and Surgeons categories had the top CTRs and CTR improvements year over year. This could partially be due to an increase of GLP-1 and weight-loss-related ads in the market as the demand for weight-control drugs has increased.
Average cost per click for leads campaigns
Not only do you want to get clicks to your Facebook leads campaigns, but you also want them to be affordable. Monitoring the average cost per click in Facebook campaigns leveraging the leads objective helps you keep your budget pacing in check.
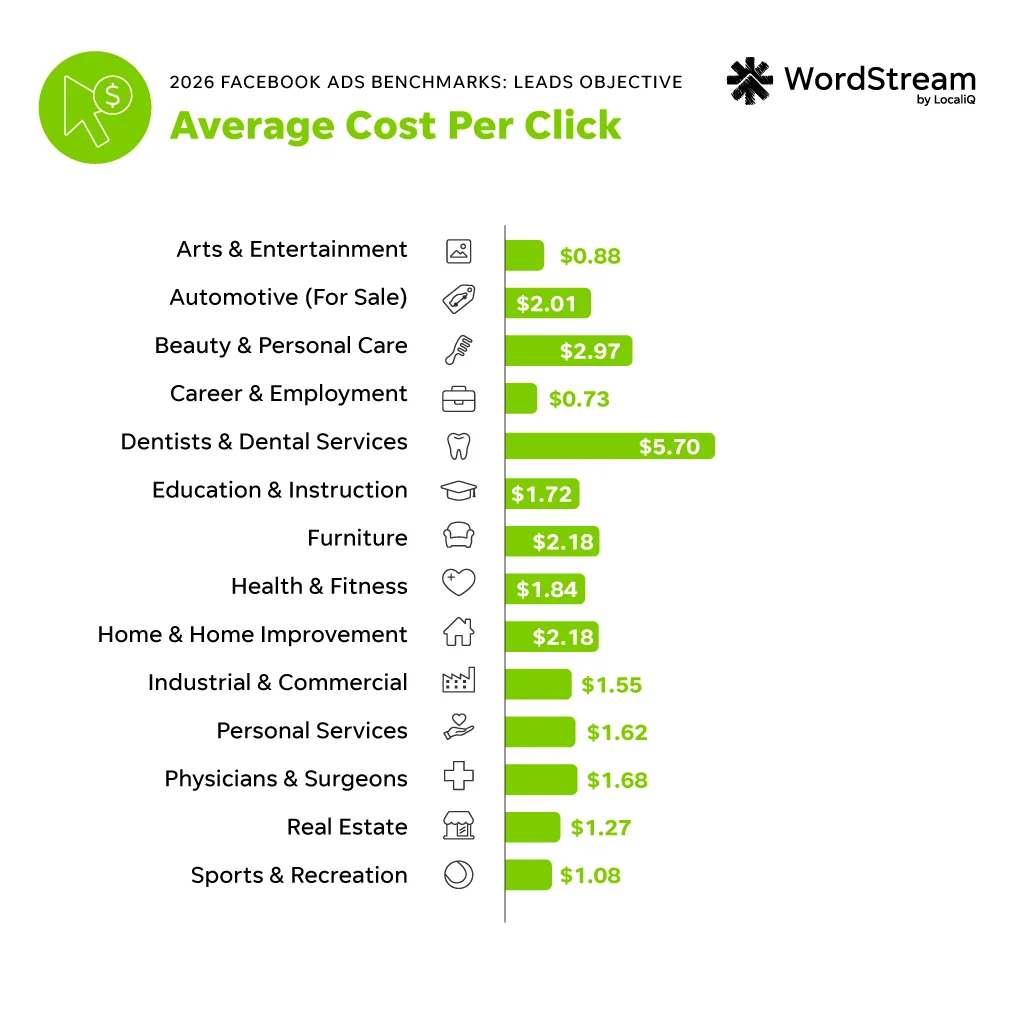
The 2026 average cost per click for Facebook ads leads campaigns across all industries is $1.80.
This is down by 6.25% compared to last year.
| Business category | Average cost per click |
| Arts & Entertainment | $0.88 |
| Automotive — For Sale | $2.01 |
| Beauty & Personal Care | $2.97 |
| Career & Employment | $0.73 |
| Dentists & Dental Services | $5.70 |
| Education & Instruction | $1.72 |
| Furniture | $2.18 |
| Health & Fitness | $1.84 |
| Home & Home Improvement | $2.18 |
| Industrial & Commercial | $1.55 |
| Personal Services | $1.62 |
| Physicians & Surgeons | $1.68 |
| Real Estate | $1.27 |
| Sports & Recreation | $1.08 |
The industries with the highest leads ads CPCs were Dentists and Dental Services $5.70, Beauty and Personal Care $2.97, and Furniture as well as Home and Home Improvement—both at $2.18.
Meanwhile, Career and Employment has the lowest average CPC for Facebook lead ads at $0.73, followed by Arts and Entertainment at $0.88 and Sports and Recreation at $1.08.
Average cost per click: YoY
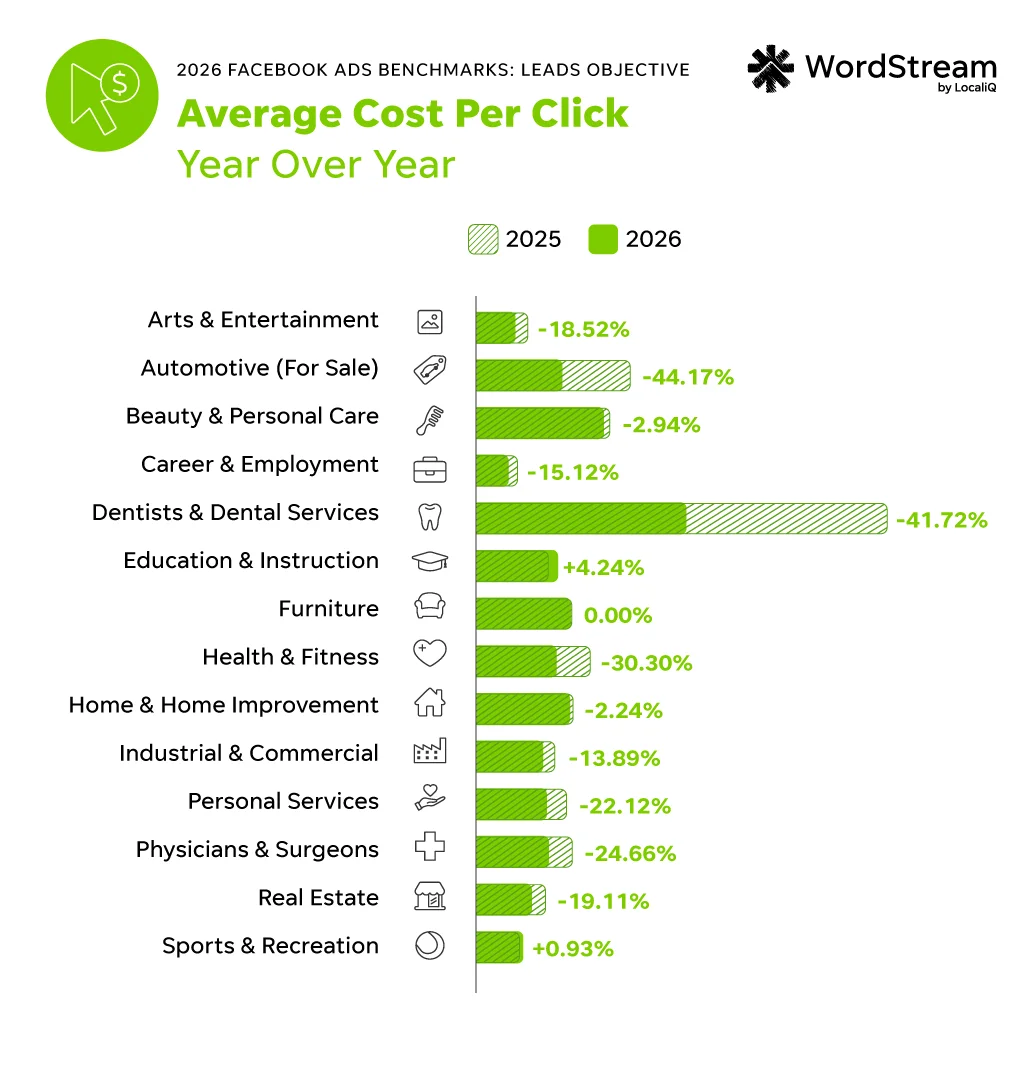
Average CPC for the leads objective improved for Automotive—For Sale, which was down 44.17%, Dentists and Dental Services, down 41.72%, and Health and Fitness, down 30.30%.
Only two industries saw a cost increase in leads campaign CPC year over year: Education and Instruction, which was up 4.24%, and Sports and Recreation, up 0.93%.
Average conversion rate for leads campaigns
The conversion rate of your Facebook leads campaigns directly ties back to the main purpose of the campaign because it indicates how efficient it is at increasing leads for your business.
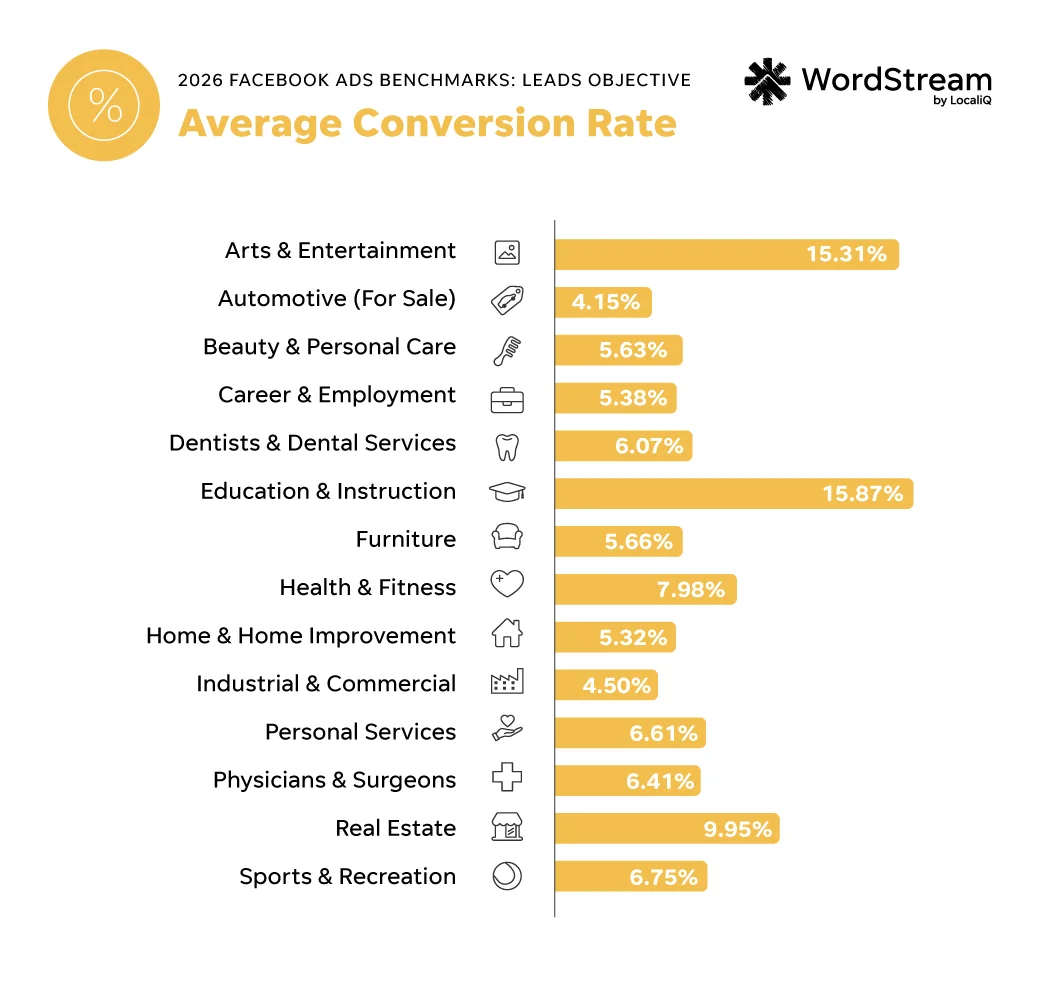
The 2026 average conversion rate in Facebook ads for leads campaigns across all industries is 8.54%.
This is a 10.62% increase compared to last year.
| Business category | Average conversion rate |
| Arts & Entertainment | 15.31% |
| Automotive — For Sale | 4.15% |
| Beauty & Personal Care | 5.63% |
| Career & Employment | 5.38% |
| Dentists & Dental Services | 6.07% |
| Education & Instruction | 15.87% |
| Furniture | 5.66% |
| Health & Fitness | 7.98% |
| Home & Home Improvement | 5.32% |
| Industrial & Commercial | 4.50% |
| Personal Services | 6.61% |
| Physicians & Surgeons | 6.41% |
| Real Estate | 9.95% |
| Sports & Recreation | 6.75% |
The industries with the highest conversion rates for Facebook leads campaigns included Education and Instruction (15.87%), Arts and Entertainment (15.31%), and Health and Fitness (7.98%).
Meanwhile, the industries with the lowest conversion rates included Automotive—For Sale (4.15%), Industrial and Commercial (4.50%), and Home and Home Improvement (5.32%).
But overall, many industries are seeing stable or improved conversion rates. “I’ve personally experienced a large improvement in conversion rate for Facebook Lead Ads, as well as a much lower cost per lead as compared to years prior,” said Brett McHale, Founder of Empiric Marketing. “Our Meta lead ads have never been more efficient, and much of that has to do with the technical improvements Meta has made to the platform over the past 12 months.”
Average conversion rate: YoY
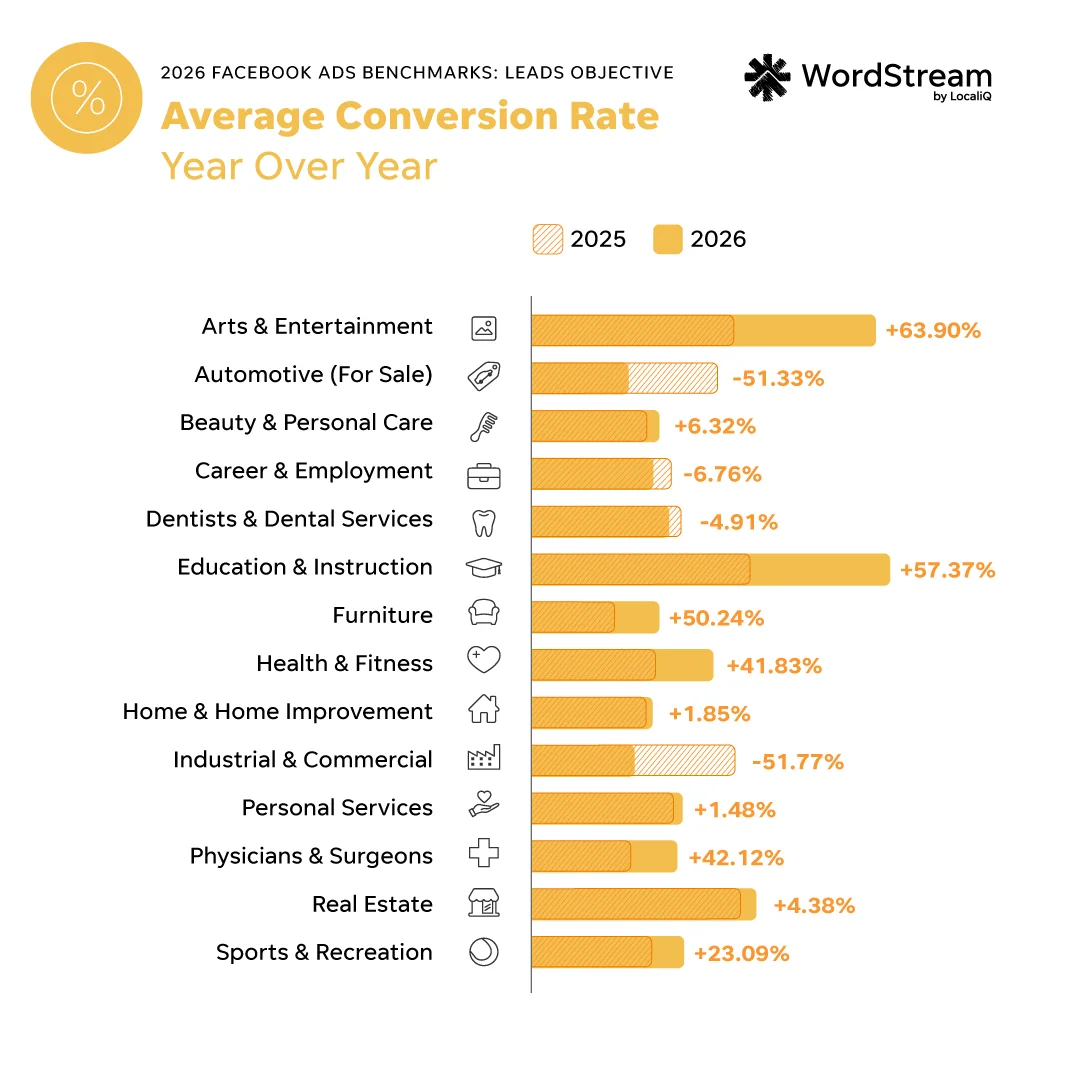
Industrial and Commercial was the industry with the biggest year-over-year decrease in conversion rate—down 51.77%. This industry was followed by Automotive—For Sale, down 51.33%, and Career and Employment, down 6.76%.
On the other hand, Arts and Entertainment was the industry with the biggest year-over-year increase in conversion rate—up 63.90%, followed by Education and Instruction, up 57.37%, and Furniture, up 50.24%.
Average cost per lead for leads campaigns
Your average cost per lead for Meta leads campaigns is your “money metric” that translates how your campaign is contributing to your business’s ROI. The lower your cost per lead, the more leads you can afford to acquire.
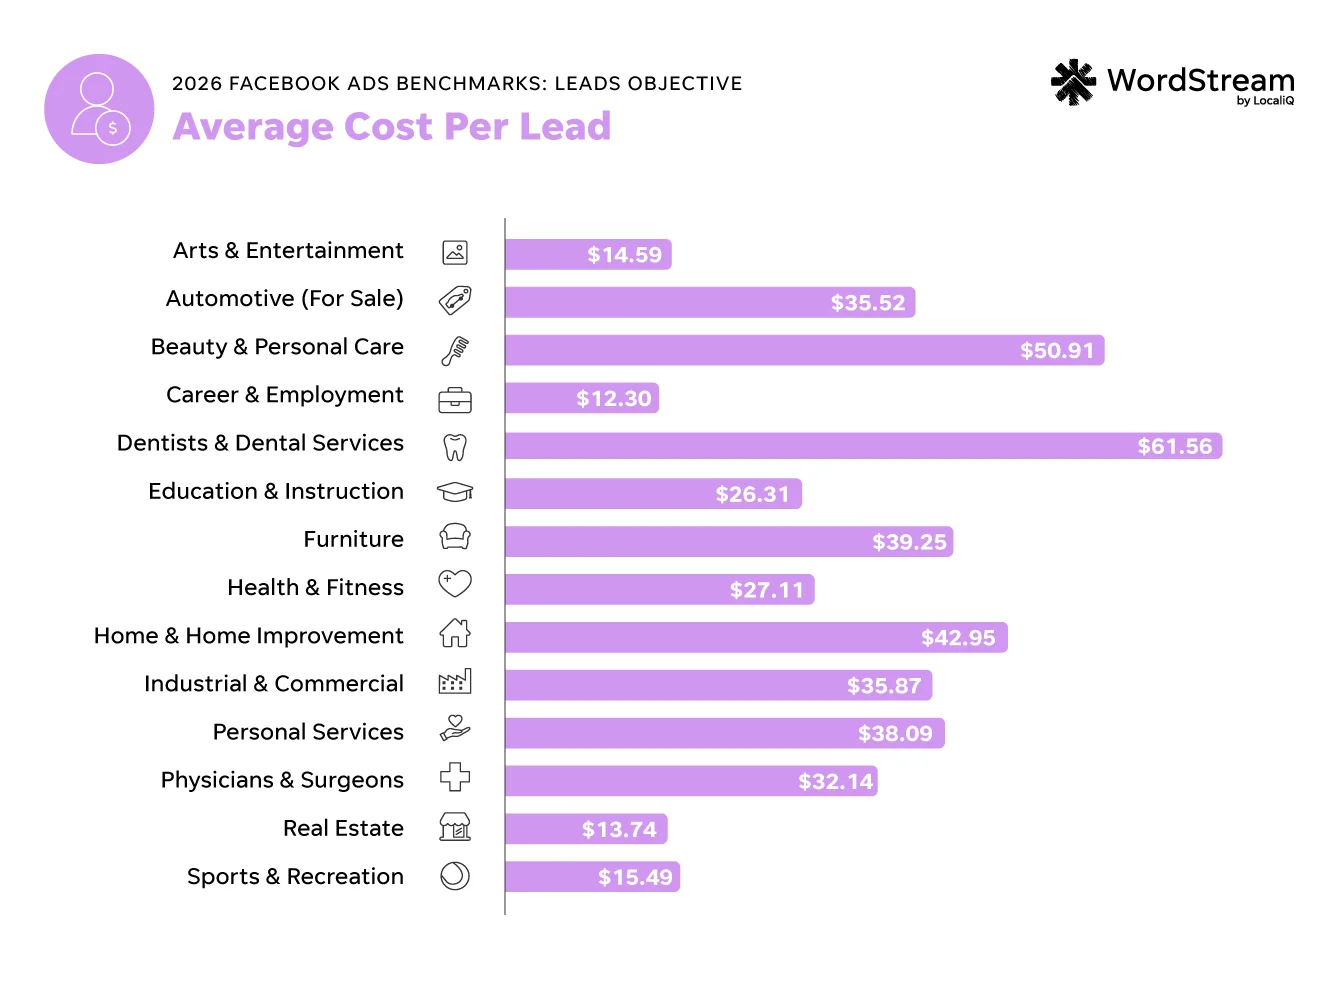
The 2026 average cost per lead in Facebook ads for leads campaigns across all industries is $27.39.
This is stable, with only a 0.98% decrease compared to last year.
| Business category | Average cost per lead |
| Arts & Entertainment | $14.59 |
| Automotive — For Sale | $35.52 |
| Beauty & Personal Care | $50.91 |
| Career & Employment | $12.30 |
| Dentists & Dental Services | $61.56 |
| Education & Instruction | $26.31 |
| Furniture | $39.25 |
| Health & Fitness | $27.11 |
| Home & Home Improvement | $42.95 |
| Industrial & Commercial | $35.87 |
| Personal Services | $38.09 |
| Physicians & Surgeons | $32.14 |
| Real Estate | $13.74 |
| Sports & Recreation | $15.49 |
The industry with the lowest cost per lead for Facebook leads campaigns was Career and Employment at $12.30, followed by Real Estate at $13.74, and Arts and Entertainment at $14.59.
Dentists and Dental Services had the highest cost per lead at $61.56, followed by Beauty and Personal Care at $50.91, and Home and Home Improvement at $42.95.
Average cost per lead: YoY
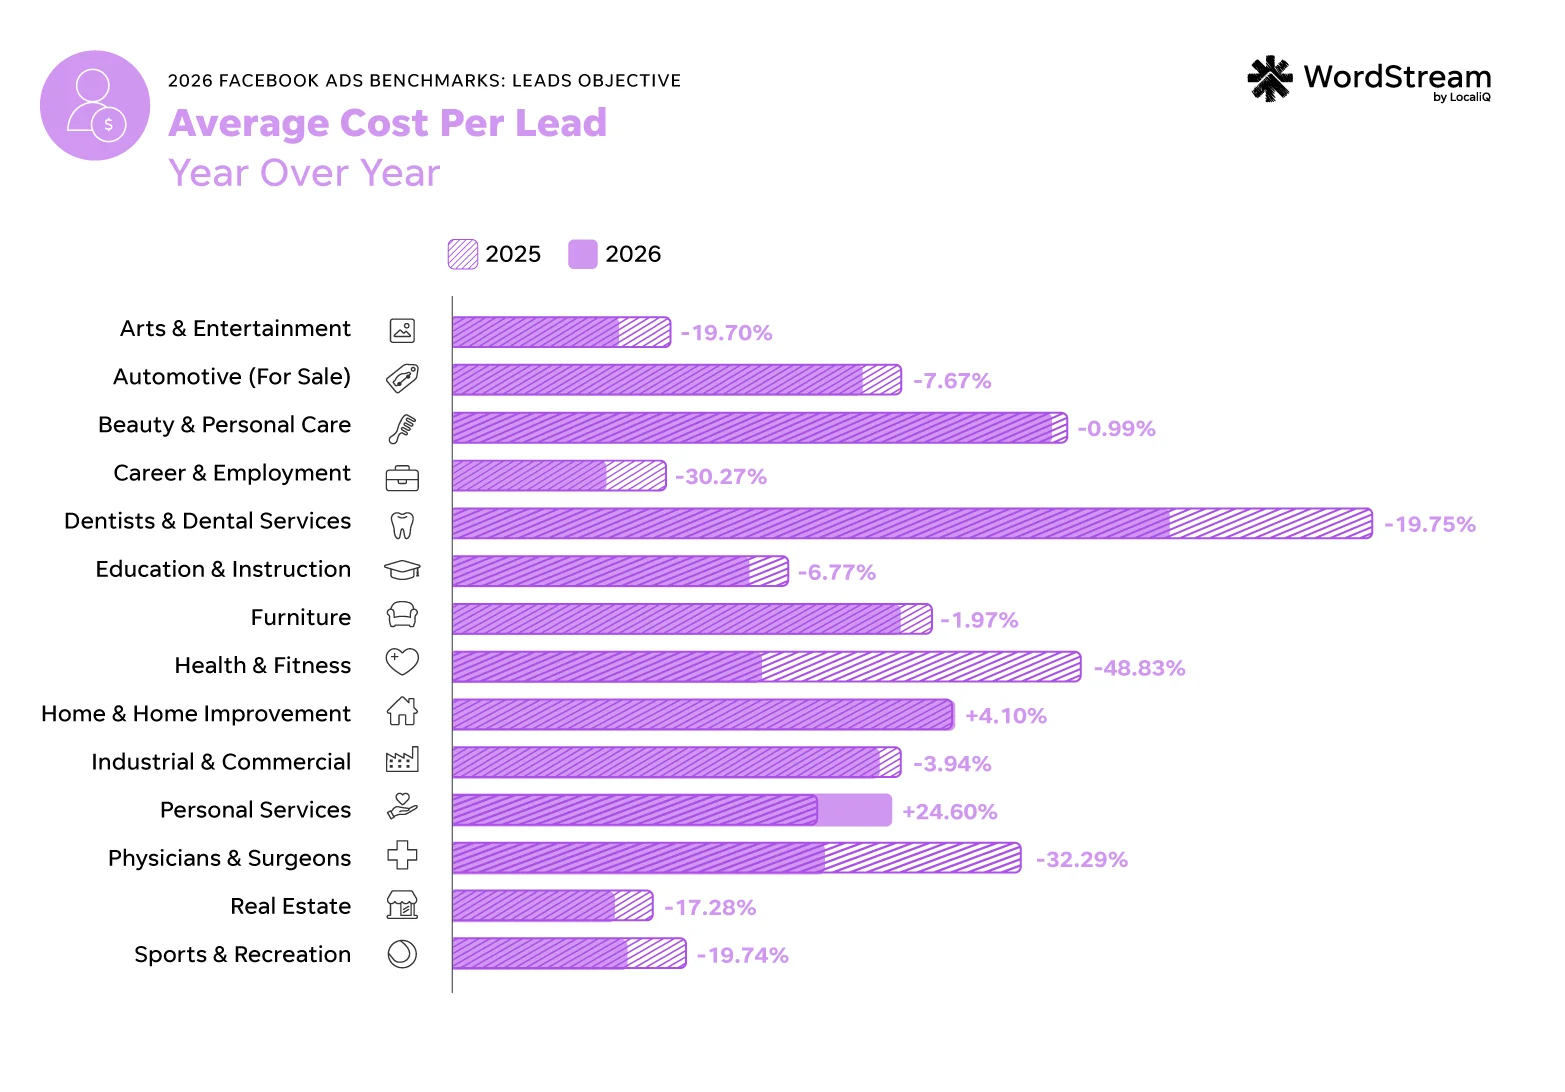
Most industries saw a decrease in average cost per lead for Facebook leads campaigns year over year, but Home and Home Improvement saw a CPL increase of 4.10% as well as Personal Services with a CPL increase of 24.60%.
The Personal Services category includes businesses such as wedding planners, cleaners, funeral homes, and more, which tend to face higher competition on platforms like Meta as users are more willing to spend in these areas, and that’s typically coupled with a longer sales cycle. Those factors can make managing cost per lead more challenging for these businesses, but not impossible—I’ll explain in our tips section!
The industries that succeeded in the biggest decreases in cost per lead for Facebook Lead Ads year over year were Health and Fitness, which decreased by 48.83%, Physicians and Surgeons, which decreased by 32.29%, as well as Career and Employment, which decreased by 30.27%.
Some of the results across the same industry seem contradictory at first. If you feel your costs are fluctuating, but so are your conversions, you may be dealing with changes in your audience pool.
“These metrics are not independent. If clicks get cheaper and a smaller share of your audience converts, CPC and CVR can both fall. Cost per lead only improves if a drop in cost per click outweighs a drop in conversion rate,” said Sai Paturi, Data Science Manager at LocaliQ.
How to improve your Meta Ads campaigns
No matter where your current Facebook and Instagram ads performance lies in reference to the averages in your industry, there are ways you can improve and optimize your campaigns. Here are our top Facebook advertising tips for this year.
1. Use Meta Ads in tandem with other channels to balance your budget
No two advertising platforms are exactly alike, so there’s not one end-all, be-all channel you should rely on for digital ads. Facebook ads work best when they’re complemented with other channels so your customers have a smooth buyer’s journey across sites and apps.
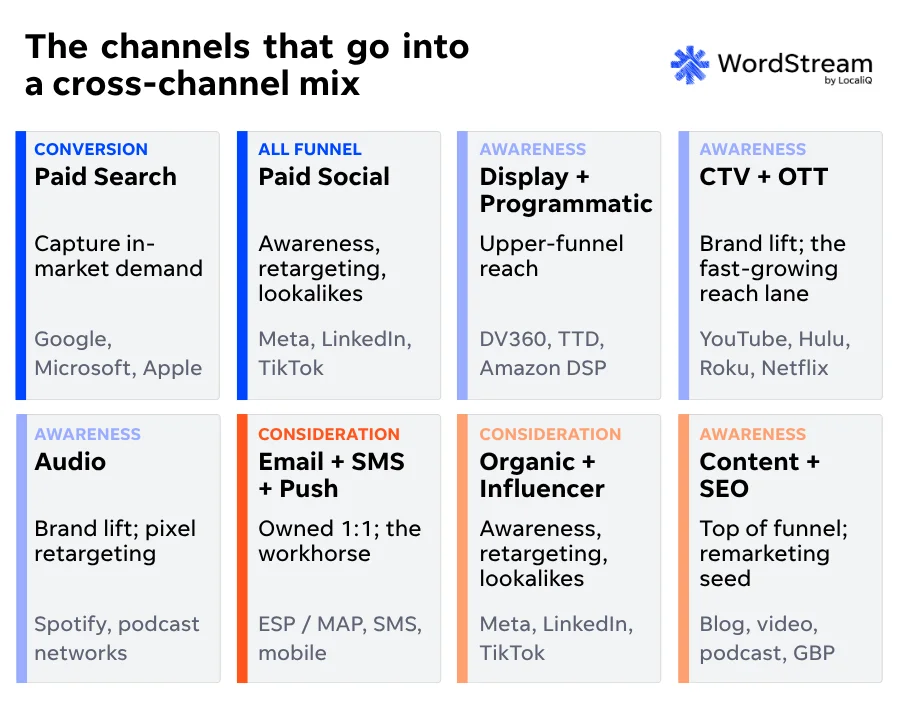
For example, you can run Facebook ads that align with your Google Ads campaigns to achieve similar goals at different costs for greater budget efficiency.
“I often see Facebook ads perform at a much better cost than Google. With the increasingly sophisticated Conversions API and AI-infused targeting abilities, it has never been easier to achieve a positive ROAS on Meta and mold audiences towards your desired outcomes,” Brett said.
📣 Want to optimize your Meta advertising campaigns to the max? Reach out for a demo to see how our solutions can help perfect your strategy!
2. Optimize your conversion tracking
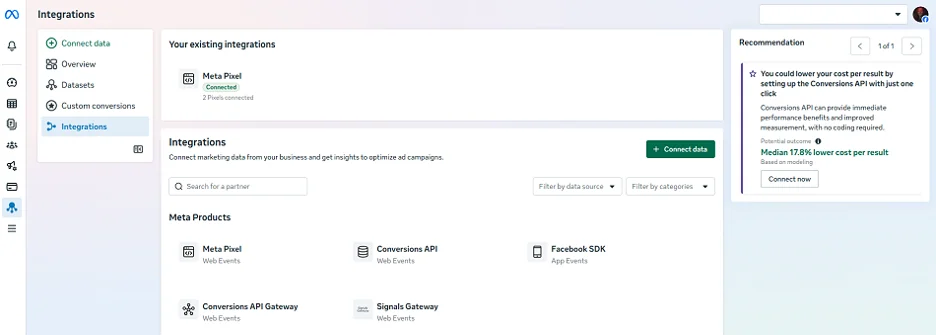
Your Facebook ads conversion tracking can make all the difference when it comes to your advertising experience. You need to make sure you’re tracking the right actions, so that everything is weighed and accounted for correctly. If you set up the Facebook Conversions API, you’ll be able to track users through their buyer journey at a granular level.
“If you are able to, 100% get Conversions API established within the account,” Brett said.
To start setting up your Facebook Conversions API, navigate over to the Events Manager section of Meta Business Suite and follow the prompts under integrations.
3. Remember that Advantage+ settings are optional
Throughout the Facebook ads setup process, you’ll be prompted to opt into Advantage+ settings when establishing your bidding, targeting, ad creative, and more. Advantage+ is a suite of automated features Meta offers to advertisers to help streamline campaign workflows using AI.
Of course, the trade-off with Advantage+ is manual control. However, most advertisers have incorporated some level of Advantage+ automation into their strategy at this point. There is no right or wrong answer as to whether you decide to take, well, advantage of all the Advantage+ features, but you will want to proceed with caution. Try rolling Advantage+ optimizations into your strategy slowly to see what works best for your business.
“At the management level, be very selective with which AI adjustments and settings you enable. At the end of the day, you are still in charge of your brand and how it is presented to the world. If there is a cosmetic setting you don’t like, disable it,” Brett said.
4. Look at a variety of metrics when measuring performance
While our report focuses on four core metrics of Facebook advertising, there are many other numbers you may want to pay attention to in your account.
Customize your Meta Business Suite reports, and try not to get hung up on any one metric. Each part of your Facebook ads campaign reports works together to tell you a complete story about performance. The relationship between multiple metrics can indicate areas for improvement.
“Each metric can be helpful and worthy of benchmarking to monitor performance trends. But understanding how they work in tandem can help you see the bigger story,” said Michelle Morgan, Co-Founder of Paid Media Pros.
Kendall agrees. “Evaluate performance across the full funnel and refresh creative or adjust the experience based on where the data shows friction, rather than reacting to one metric in isolation,” she said.
“High CTR but low CVR? You have great creative, but you’re not delivering on the promise. In these instances, your call to action is too intense, not appealing, not aligned with the creative, etc. Maintain the strong creative but adjust your CTA to be in line with the expectations and experience you’re setting there.”
“High CPCs but low CPL? Despite reaching a lot of folks, you’re warning off those who aren’t the right fit and still finding the right target audience who is willing to convert at a high rate that keeps CPL low,” Michelle said.
5. Tweak ad creative according to your audience
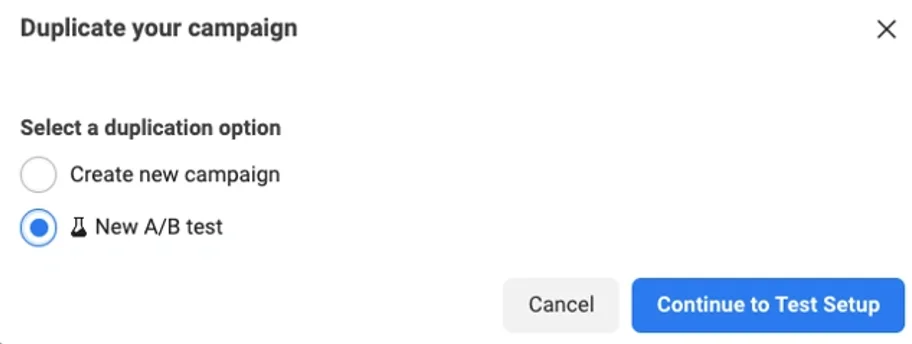
The most successful Facebook advertising accounts A/B test creative elements on their ads often. You may need to have different visuals or messaging depending on the audience lists you target. Don’t be afraid to play around with your ad assets on a regular basis to inform your strategy.
“Audience controls on Meta can vary in efficacy. What we’re finding drives better results? Treating your creative as your targeting and letting Meta optimize for your outlined conversion action,” Michelle said.
Mat Wendler, Senior Manager of Optimization Strategy & Custom Solutions at LocaliQ, agrees that testing is essential.
“Being open to testing new creative, adjusting messaging, refining audience targeting, and experimenting with different ad formats can help see what resonates most with the audiences you are going after,” Mat said.
“A/B testing is especially valuable, as it allows you to compare variations of creative, imagery, headlines, or messaging and make data-driven decisions based on performance. Consistent testing and optimization are often the key to improving results over time and maximizing your return on ad spend,” he said.
“Start by having sound, accurate conversion tracking on the goal you want. Then, leverage both the imagery/videos and the text portion of your ads to speak (implicitly and explicitly) to your target audience,” Michelle said.
What these 2026 Facebook ads benchmarks mean for your business
These Facebook and Instagram ads benchmarks are meant to help you make confident decisions about your campaigns by establishing how your current performance compares to your average competitor. Use this data as a guiding light when you’re unsure if a new campaign is doing well or if your current campaigns need to be tweaked.
If your results don’t always align with the averages in your industry, don’t fret! Your Meta Ads strategy has flexibility, so you can always shift your strategy as trends evolve. Plus, you don’t have to navigate the nuances of Facebook advertising alone. Reach out, and one of our experts will show you how our solutions can help transform your strategy.
About the data
The traffic objective data is based on a sample of 1,377 US-based Facebook advertising campaigns running between April 1, 2025, and June 30, 2026. Each subcategory includes at minimum 11 unique active campaigns.
The leads objective data is based on a sample of 452 US-based Facebook advertising campaigns running between April 1, 2025, and June 30, 2026. Each subcategory includes at minimum 4 unique active campaigns.
For both objectives, “averages” are technically median figures to account for outliers. All currency values are posted in USD.
About the WordStream Blog
We've been a trusted source of data, news, and strategy for over 15 years. All of our content is written and reviewed by real people: a dedicated team of professionals with decades of combined experience in marketing and advertising for businesses of all sizes.


Add us as a preferred source on Google

Meet The Author
Susie Marino
Susie is the Senior Content Marketing Specialist for WordStream and LocaliQ, where she uses her experience as a PPC consultant to share tips, tactics, and best practices in the ever-evolving marketing and advertising space. Susie’s work has been featured in publications such as Search Engine Land, MediaPost, Social Media Today, and others. Outside of work, Susie loves to get outside for some snowboarding or (once the cold weather melts away) hiking!


![How to Run Watch-Worthy Facebook Video Ads [Complete Tutorial]](https://www.wordstream.com/wp-content/uploads/2026/03/facebook-video-ads-feature-image.jpg)