Local SEO is essential to smaller businesses that operate on a regional, as opposed to a national, level. While national SEO focuses more on ranking in searches across the country, local SEO prioritizes appearing on SERPs in a specific location. This strategy relies on marketing your brand, products, and services to local leads and customers.
Optimizing your local SEO means more website traffic, leads, and conversions since the strategy is more relevant to your base of local customers. Think of this focused strategy as a way to help you compete more effectively against larger national brands that have unlimited resources to spend. By focusing on specific local-SEO to-dos, you can neutralize the advantage of bigger brands that routinely optimize for broader keywords and rely on brand recognition, instead of value propositions, to bring in traffic.
Further, 35% of all search traffic is local according to an estimate in a 2017 ReviewTrackers’ study. Without local SEO, your business could be losing out on a significant amount of traffic.
Here are the top 10 ways you can make your local SEO successful.
1. Create a Google Business Profile
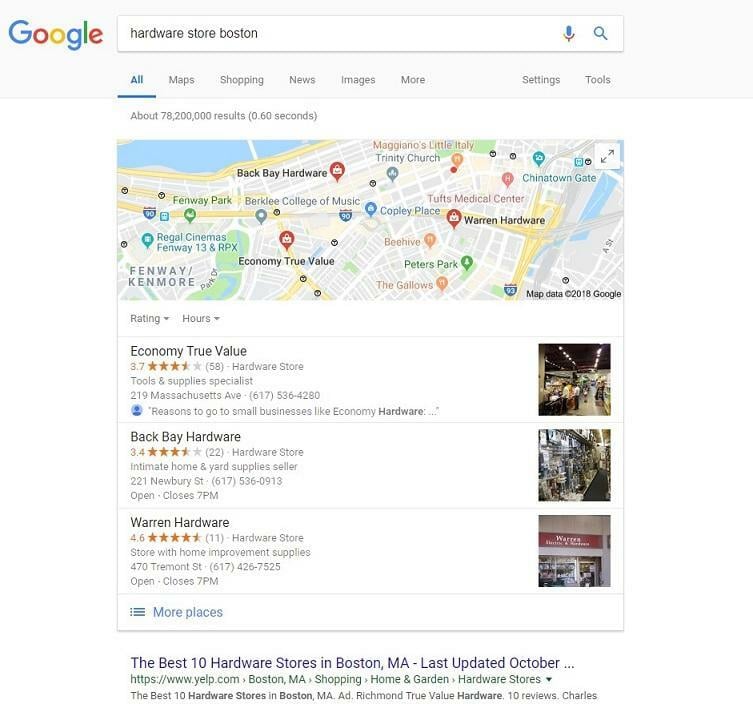
Optimizing your Google listing (aka your Business Profile) is perhaps the most effective way to rank higher on Google Maps as well as gain visibility in Google Search local results. In order to get access to your Business Profile to make these optimizations, however, you need a Google My Business account associated with that profile. Once you provide all of the requested information in your Google Business account dashboard, all of that information will be added to your Business Profile, which appears in Google Search local results, the Google Search Knowledge Panel, and Google Maps.
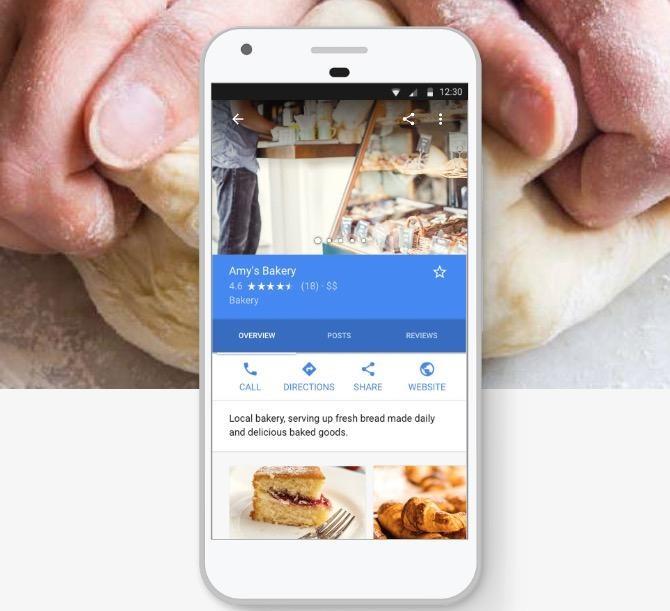
To optimize your Business Profile on Google, ensure that you:
- Create a Google Business account and verify ownership of the business
- Provide accurate and up-to-date information
- Include your logo, hours of operation, acceptable payment methods, the product or service you sell, and plenty of images
- Encourage your customers to review your business online
- Respond sincerely to customer reviews
- Publish posts (announcing products, events, and special offers) to your Business Profile using the Google My Business dashboard.
📍 Are your listings optimized for local search?
Find out with our Free Business Listings Grader!
2. Get Regular Reviews from Happy Customers
Getting your customers to write glowing reviews for your business doesn’t just optimize your Google My Business presence; it also encourages more local customers to buy from you. BrightLocal’s 2017 Local Consumer Review Survey reveals that 85% of customers believe online reviews as much as personal recommendations.
Here are some tips to encourage customers to leave reviews:
- Ask for a review in person after the close of a sale
- Send a post-purchase email or text asking customers to write a review (but only after you’ve screened them via an internal survey to ensure you’re not approaching dissatisfied customers)
- Respond to existing reviews in a professional way, thanking reviewers and addressing complaints in not-so-favorable reviews
Note: Google says it’s okay to ask your customers for reviews while Yelp actively discourages it.
3. Optimize for Voice Search
Voice search will grow rapidly in the coming years. Therefore, in local SEO, it’s vital to optimize for how people ask questions when they speak into devices, as opposed to how they type out their searches.
Essentially, your customers use more long-tail keywords when doing voice searches compared with regular search. Because of this, you’ll also have to adjust the SEO of your content to fit the more conversational tone of someone speaking. For example, you’ll want to account for the traditional question starters (who, what, when, where, why and how).

It’s also crucial to consider user intent when optimizing for voice, as these searches are most often performed when the user needs a specific piece of information. If they’re baking and ask Alexa to convert tablespoons to cups, they’re expecting a quick and useful answer. If a potential customer uses voice search to ask what your business’s hours are, this information should also be readily available
4. Create Content Based on Local News Stories or Events
There’s nothing quite like authoring content that speaks or relates directly to a local issue to grab your local customers’ attention.
Some strategies include:
- Writing blog posts around local news stories, activities, or events
- Creating videos about local charities or causes that your business supports
- Setting up location-specific webpages on your website with high-quality local content if you serve different parts of a region


Let’s say you’re a local real estate business. You can create different pages, one for each of your locations, where you can feature hyperlocal content around news events or changes in the local real-estate market. This strategy could also help you get ranked for each specific location.
5. Optimize Your Website for Mobile
A 2018 Stone Temple study that looked at 2017’s mobile vs. desktop trends found that the shift to mobile is occurring faster than expected. Mobile visits to websites grew from 57% in 2016 to 63% in 2017, and the overall visits to websites from desktop shrunk from 43% in 2016 to just 37% in 2017.
Another 2017 study from Acquisio determined that traffic from local searches can be especially lucrative, with a remarkable 75% of all mobile searches that exhibit local intent actually producing in-store, offline visits within 24 hours.
This confirms that you have to optimize your website for mobile to be a player in local SEO (and, really, for good SEO period).

Here are some tips to achieve this:
- Ensure your website loads quickly (no more than three seconds)
- Use bigger fonts that are easy to read
- Use images and copy sparingly, conveying only the information you need (no room for filler on a mobile screen!)
- Ensure intuitive UI for great UX
6. Hone in on Local Keywords
Your keywords should be relevant to local customers. It only makes sense, doesn’t it?
Google’s own Keyword Planner lets you filter keyword searches based on location so you get an idea of the popular search terms for a given region. This lets you create a list of locally relevant keywords to target. Once you have them, they should make appearances in your site’s meta content, copy, and URLs.
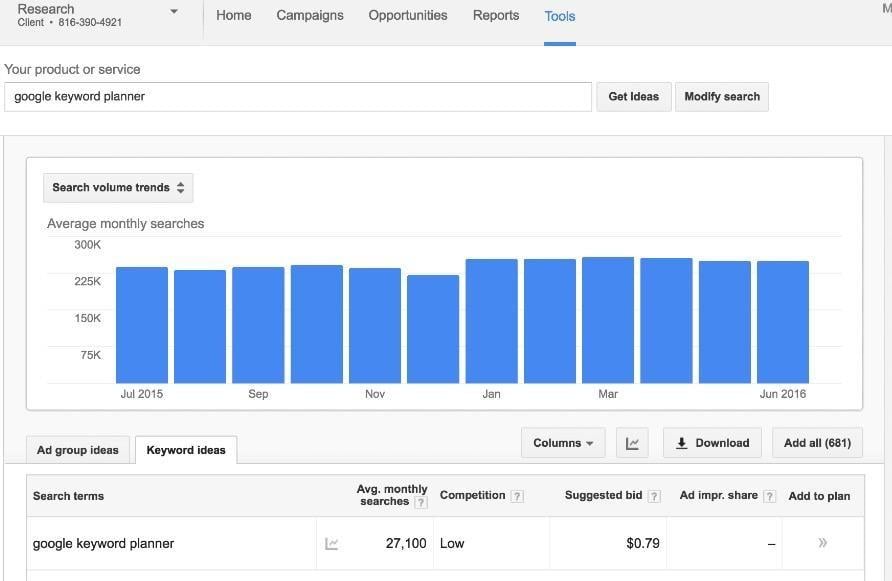
Also, include mentions of region-specific landmarks and hotspots in your content. For instance, if your local restaurant serves dinner in downtown Seattle, include references to “dining by the Space Needle” or “just steps from the Space Needle” on your site.
RELATED: Find out how to do local keyword research.
7. Use Location Pages or a Location-Specific “About Us” Page
Location pages are a must if your business has more than one location in an area. These pages need to provide the following, at a minimum:
- Store hours
- Name, address, and phone number
- Individualized descriptions
- Testimonials
- Promotions
- Parking availability
- Google Maps attached to each location page
Take care when you have multiple locations, because you need to create unique content for each page.
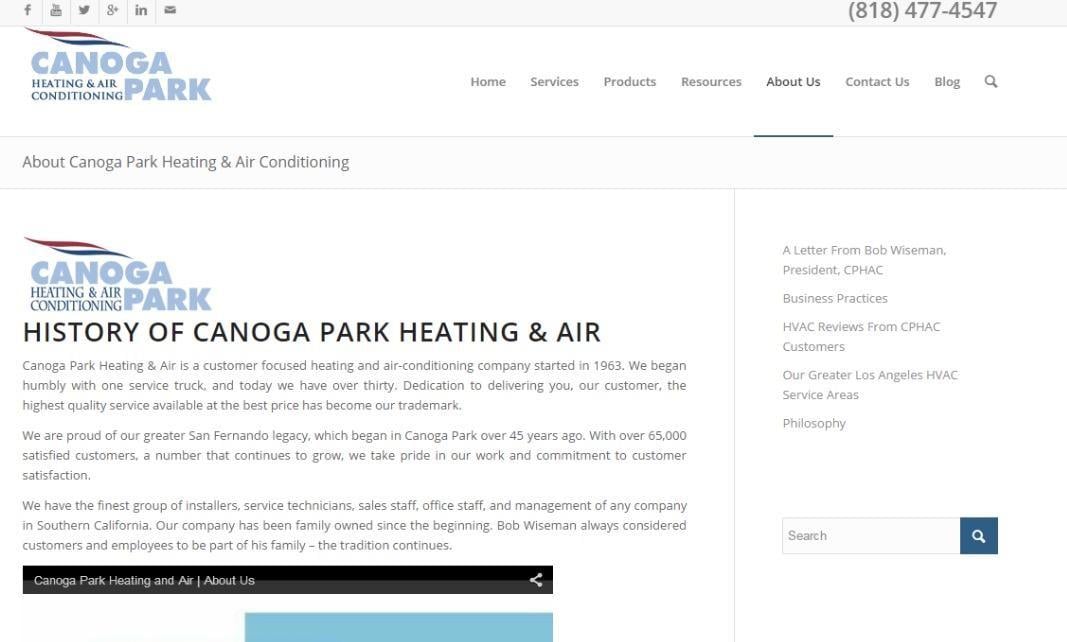
If you only have one location, creating an “About Us” page that focuses on local, relevant information is essential. For example, if you have a florist shop, your “About Us” page is the perfect spot to mention your shop’s involvement in supplying the flowers for any parades in your town or city.
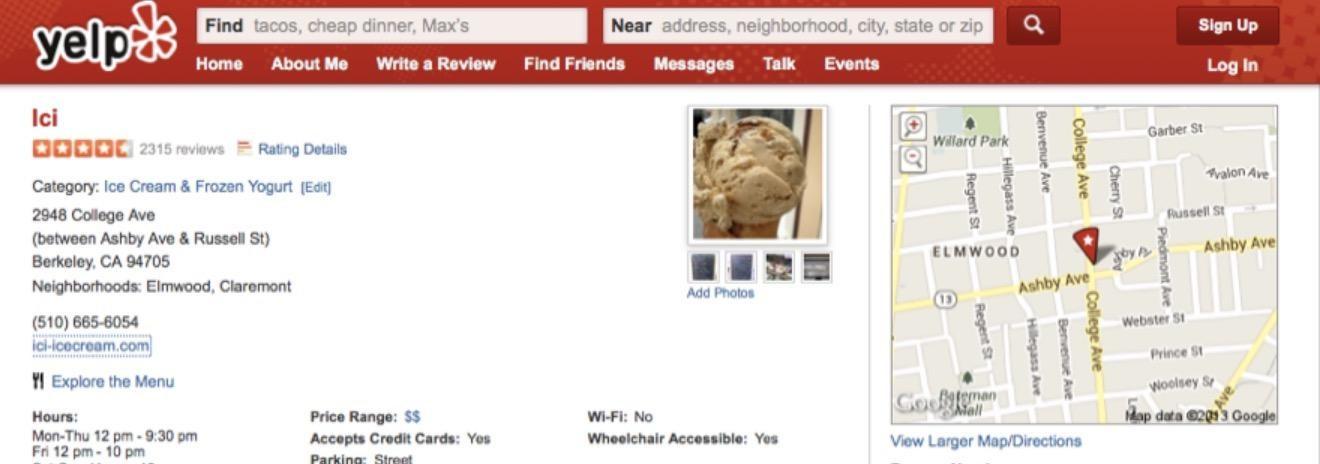
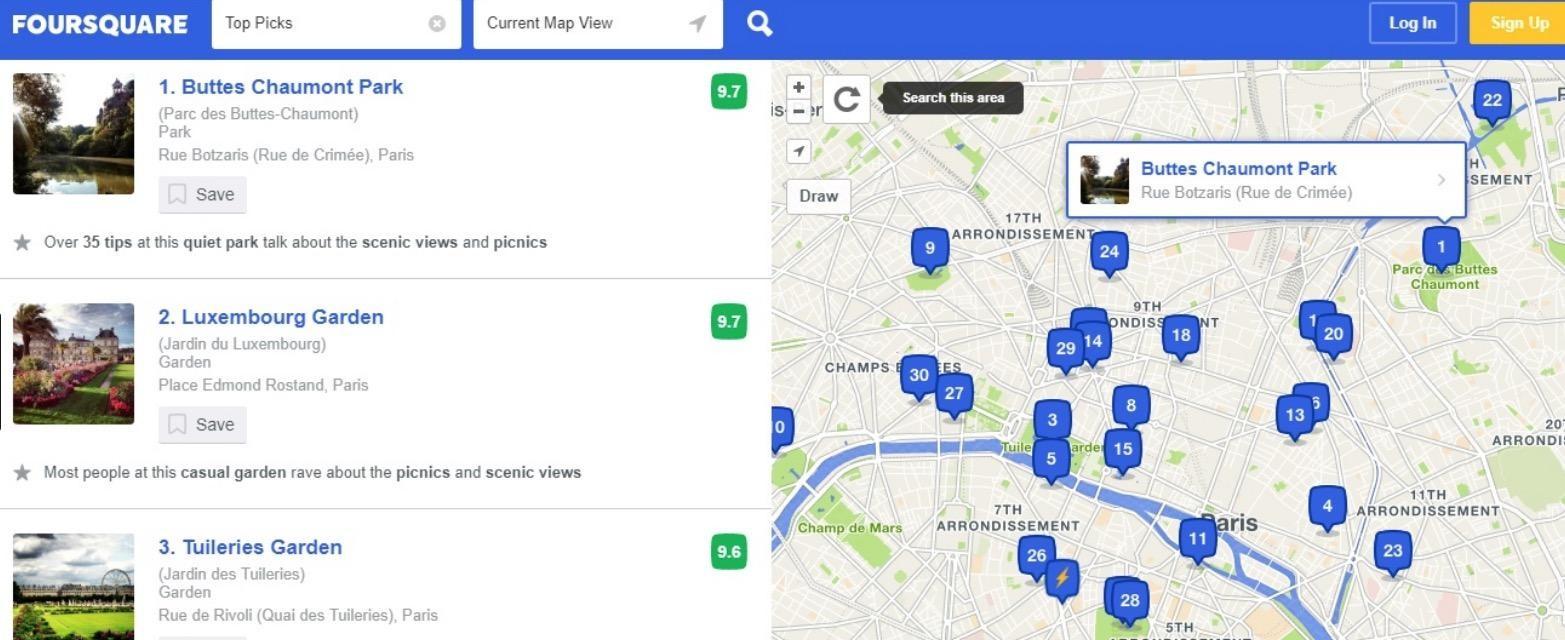
8. Take Advantage of Online Business Directories
Online business directories are websites like Yelp, Foursquare, MapQuest, and YellowPages, just to name a few. There are many more.
Not only will getting your business name, address, and phone number into these directories help visibility, but it’ll also boost your local SEO.
Your company listing should include the following basics:
- Business name (creative business name ideas here!)
- Address and phone number
- A backlink to your website
- A thorough description of your business
These should be consistent across all directories.
9. Focus on Link Signals (Get High-Quality Backlinks)
According to Moz’s 2017 Local Search Ranking Factors study, link signals are the first- and second-most important factors for local pack (or snack pack) results and for localized organic results, respectively. Link signals are backlinks pointing to your site.
It’s vital to get links to boost your local SEO, but their quality is important.
Here are some tips on getting high-quality backlinks:
- Create high-quality content on your site so others want to link to your content
- Guest blog on reputable sites with a high domain authority
- Engage with local influencers on social media or by email to get them to link back to you
10. Create a Dedicated Webpage for Each Product/Service You Offer
While it can be tempting to just lump all of your products or services together in one big page, resist doing so. Instead, dedicate one page to each unique product or service you offer.
Your local SEO juice isn’t as powerful if you lump everything into one page because search engines tend not to see your brand as an authority in one specific area. This lowers your ranking possibilities.

If you’re a business without different products or services, but have various locations, simply utilize location-based copy for each page. For instance, “dental marketing” will become “New York dental marketing” or “Buffalo dental marketing.”
Local SEO: More Important Than Ever
SEO changes quite rapidly. You never know when Google will introduce new features on its SERPs for local searches, but you can count on these changes coming. That’s why it’s essential to always stay on top of local SEO. By implementing these 10 actionable items, you will ensure that your business doesn’t just take advantage of lucrative local searches but also has a solid foundation when new SEO features are introduced. And if you don’t have the bandwidth to make these adjustments, you may want to try a local seo audit, or look into a small business SEO service provider.
Are you wasting money in Google Ads?

Meet The Author
Marc Schenker
Marc Schenker is a copywriter and marketer who runs The Glorious Company, a marketing agency. An expert in business and marketing, he helps businesses and companies of all sizes get the most bang for their ad bucks.