With an average 200% return on investment, it’s not surprising that Google Ads is one of the most popular—and most competitive—paid advertising channels for businesses large and small.
This is reason enough for advertisers to stay on top of their performance, but with our latest benchmark study showing that cost per lead has increased for 91% of industries year over year, it’s more important now than ever.
Read on to get the insights you need so you can stay competitive with your holiday campaigns, plan your 2023 budget, and navigate the challenging economy.
✴️ Note: We update this data regularly!
Download the PDF of our latest Google Ads Benchmarks report here.
Key trends
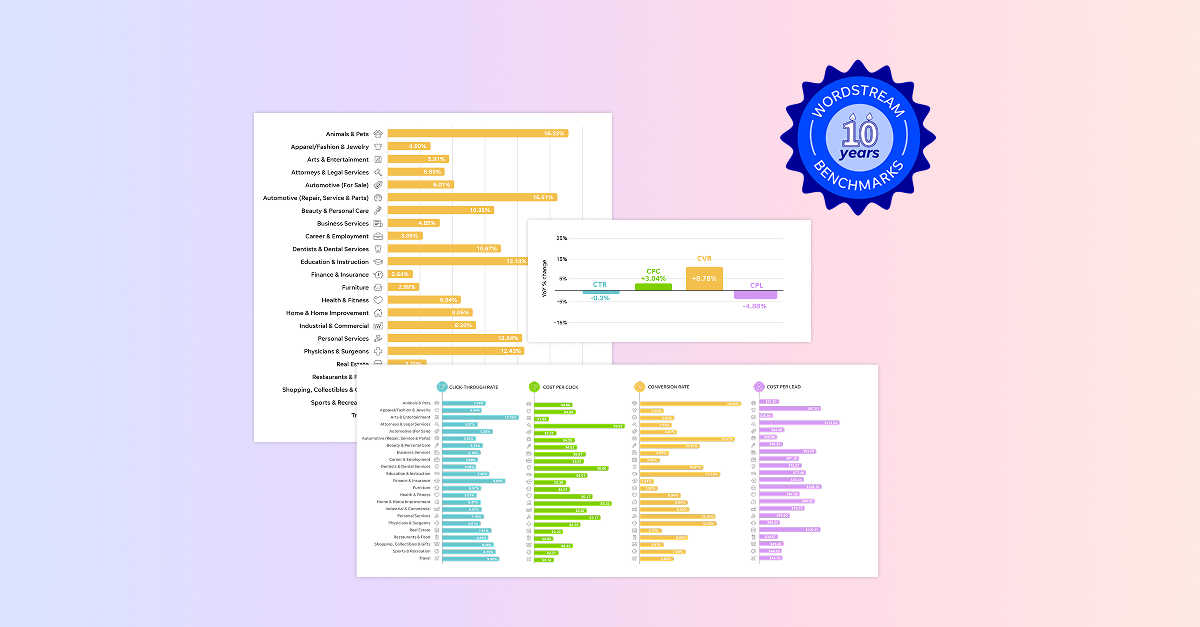
Our latest Google Ads industry benchmarks report provides the average click-through rate (CTR), cost per click (CPC), conversion rate (CVR), and cost per lead (CPL) for 23 industries. Note that our proprietary platform dynamically shifts budget between search channels on a per-campaign basis, but in aggregate, 80-85% of budget is allotted to Google and 15-20% to Microsoft.
Here are the most important trends to know:
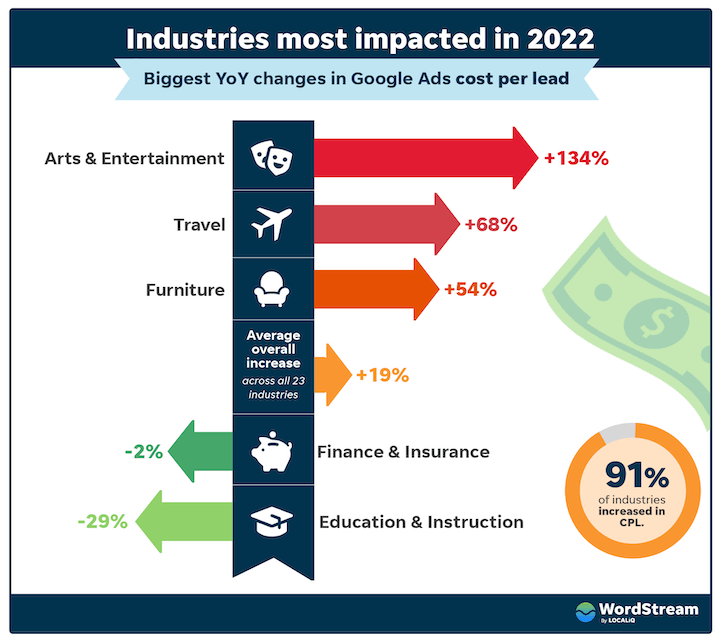
- Cost per lead has increased significantly. 21 of 23 industries saw an increase in cost per lead (CPL) year over year, with an average overall increase of 19%. This is significantly higher than last year’s increase of 5%, in contrast to 2020’s decrease of 4%, but actually similar to 2019’s increase of 21%.
- The biggest increases in CPL were in Arts/Entertainment (+134%), Travel (+69%), and Furniture (+54%); while Education/Instruction (-29%) and Finance/Insurance: (-2%). As we’ll discuss in the key takeaways, inflation appears to be the main driver here.
- Conversion rate has decreased significantly. 91% of industries saw a decrease in conversion rate, with an average overall decrease of 14%. While this is a stronger decrease than last year, it is not far off from 2019’s 12% decrease.
- Cost per click has increased only slightly. Just over half (57%) of the industries we looked saw an increase in CPC, with an average overall increase of 2%. This is in contrast to 2020 and 2021 which saw decreases in CPC (-4% and -1% respectively), but comparable to 2019 when there was a 6% increase.
- Click-through rate has remained stable. While 78% of the industries in our report saw an increase in CTR year over year, there was no overall average change. This is the first time since 2019 that CTR has not increased.

With the exception of click-through rate, 2022’s YoY changes are similar to those of 2019, before the pandemic.
Key takeaways & how to adapt
So what’s behind these trends in the data? Why are small businesses seeing these impacts and what can you do about it? We believe that a combination of factors is at play, including economic factors and changes in how Google’s ad platform works.
Here are the primary causes as we see it—plus recommendations on how to adapt:
1. Inflation is impacting conversion rates
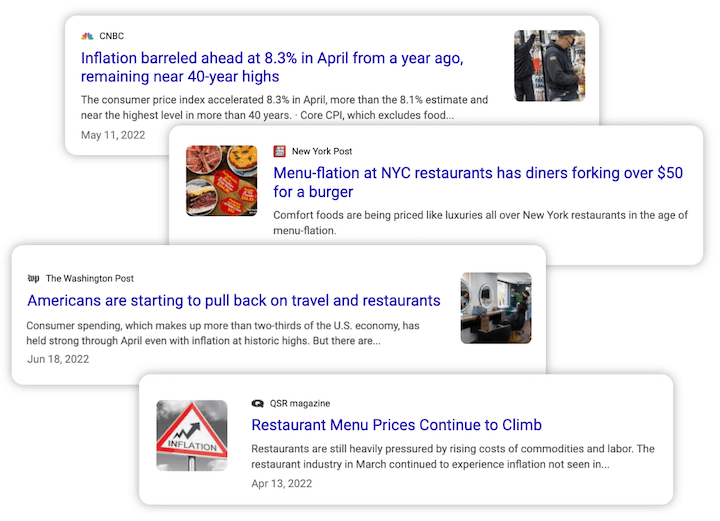
Not only is the consumer price index near its highest level in 40 years, but the cost of running a business, of course, has also increased. For example, many restaurants have had to raise menu prices to counteract rising food costs. With prices at an all-time high, consumers have become more conscious of their spending, especially for non-essential goods and services. In June, the Washington Post shared that consumers were cutting back on travel and restaurants.
This could be bringing down conversion rates and driving up cost per lead, and would help explain why the industries in our study that saw the biggest increases in CPC and/or CPL year over year were Arts/Entertainment, Travel, Furniture, and Apparel/Fashion/Jewelry; and potentially also why Education/Instruction and Finance/Insurance were the only two industries that saw a decrease (albeit small) in CPL.
Another factor that is likely at play with the increase in Furniture CPL is supply chain shortages.
Inflation could also be causing more advertisers to pull back on ad spend. According to Search Engine Land, Google’s FY22 Q3 earnings showed slow growth for ads, and leadership is attributing the declines to advertisers pulling back on spend. SEL says the slow growth “could be a warning to advertisers that further budget cuts and higher CPCs could be on the horizon.”
How to adapt
In his article on Marketing During Inflation, Mitchell Leiman, Sr. VP of Strategy and Operations at LocaliQ, reminds us that although inflation is a top concern among small business owners, it is most likely temporary and there are ways to adapt.
He suggests examining your costs and profit margins and finding ways to cut costs, making use of free and low-cost methods of marketing, evaluating your cash and debt, and raising prices if you need to. You can get more details in his article, as well as use our price increase letter tips and templates.
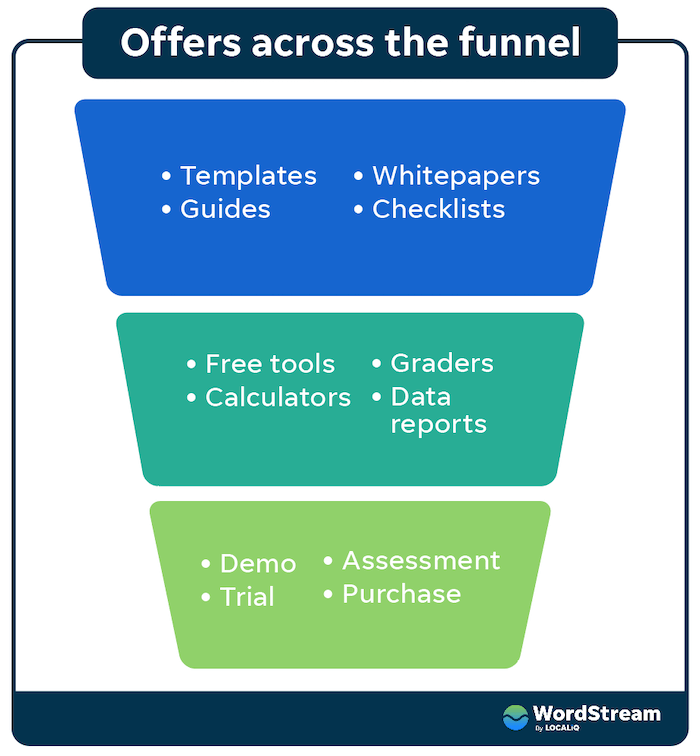
A full-funnel approach can also help with improving your conversion rates. Rather than striving just for bottom-funnel conversions, create campaigns for lower-friction offers to drive awareness and engagement up-funnel. You can then nurture those leads with email campaigns to build trust and/or retarget them with lower-funnel offers.
2. Broad match is broader than ever
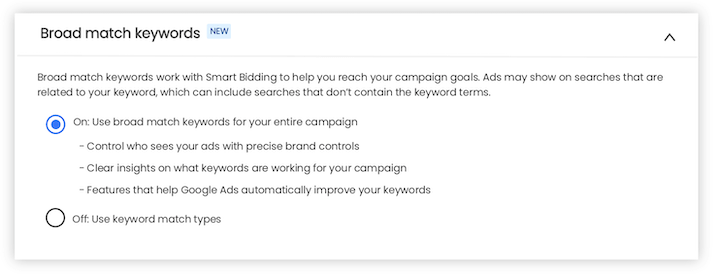
Not only did Google remove modified broad match keywords last year, but since then it has also been pushing for accounts to use broad match with Smart Bidding—going so far as to release a limited beta test recently that allows advertisers to remove keyword match types altogether at the campaign level.
Broader matching is leading ads to appear for more queries—including those with low commercial intent. Since CTR hasn’t changed overall, we can gather that people are still clicking on ads just as much, but since the intent isn’t there, they’re not converting.
How to adapt
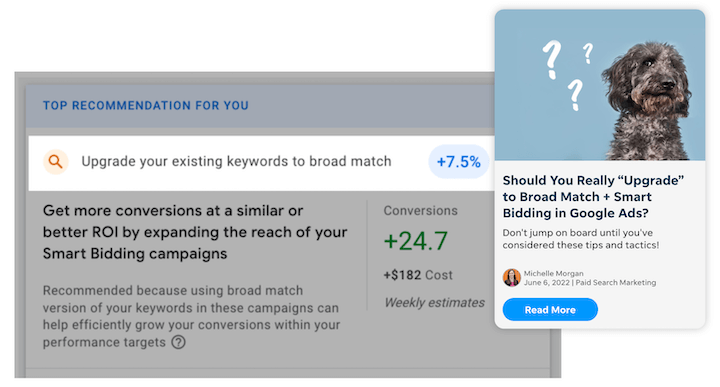
In her article on Google’s push for broad match with Smart Bidding, international paid media consultant and speaker Michelle Morgan recommends using phrase match, exact match, or dynamic search ads instead; but that if you do end up going with Google’s suggested “upgrade,” to make sure you have enough conversion data to start with, regularly review your search queries, be conservative with budget, and set bidding restrictions to start.
Devon Anderson, VP of Media Delivery & Automation at LocaliQ points out that in addition to the removal of modified broad match, “We are also seeing phrase match and broad match keywords matching more broadly in general, leading ads to show for competitor searches and irrelevant search phrases if extra precautions are not taken proactively.” To keep your ads appearing for the right searches, be sure to stay on top of your keyword performance, regularly maintaining your negative keyword lists.
3. Search ads continue to get more competitive each year
This is par for the course because of the sheer efficacy of Google Ads: Given that 89% of buying journeys begin with a search engine, it’s no wonder that PPC yields an average ROI of $2 for every $1 spent—and therefore not surprising that more and more advertisers are using the platform.
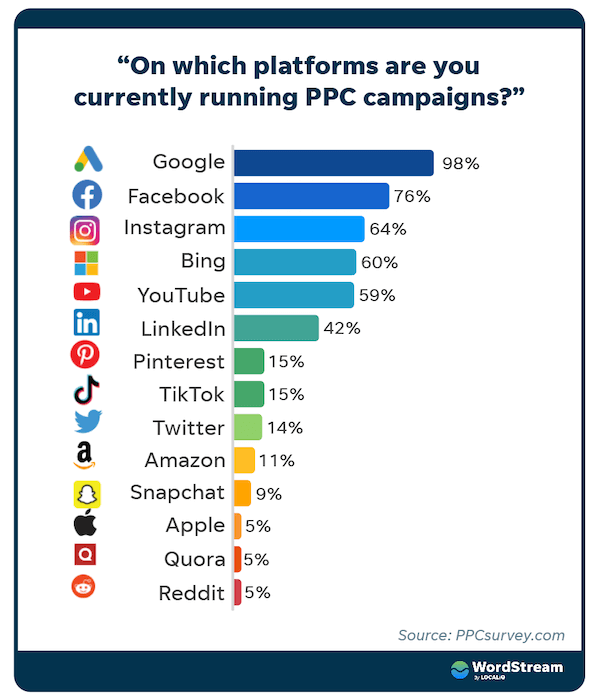
In PPCsurvey’s 2022 State of PPC report, 98% of participants reported using Google Ads, versus 76% for Facebook and 64% for Instagram. The more advertisers in any given channel, the higher the competition, which leads to higher bids for fewer clicks per advertiser.
How to adapt
In order to attract the same volume of traffic and leads amid the higher competition, you may want to increase your budget—not just in 2023 but during the holidays this year. If an increase in budget is not feasible, our article on eight ways to compete in Google Ads without raising bids guides you through improving your ad relevance and Quality Score, optimizing your keywords, examining your competition, and more.
We also recommend using a cross-channel marketing strategy, as paid search is often more effective when used in conjunction with other channels. In her article on the top four advertising channels, for example, international paid media consultant and speaker (and WordStream alum!) Navah Hopkins recommends using display to build your audiences, video ads for demand gen, and social for enabling “impulses.” You can also find more cross-channel advertising tips from Michelle.
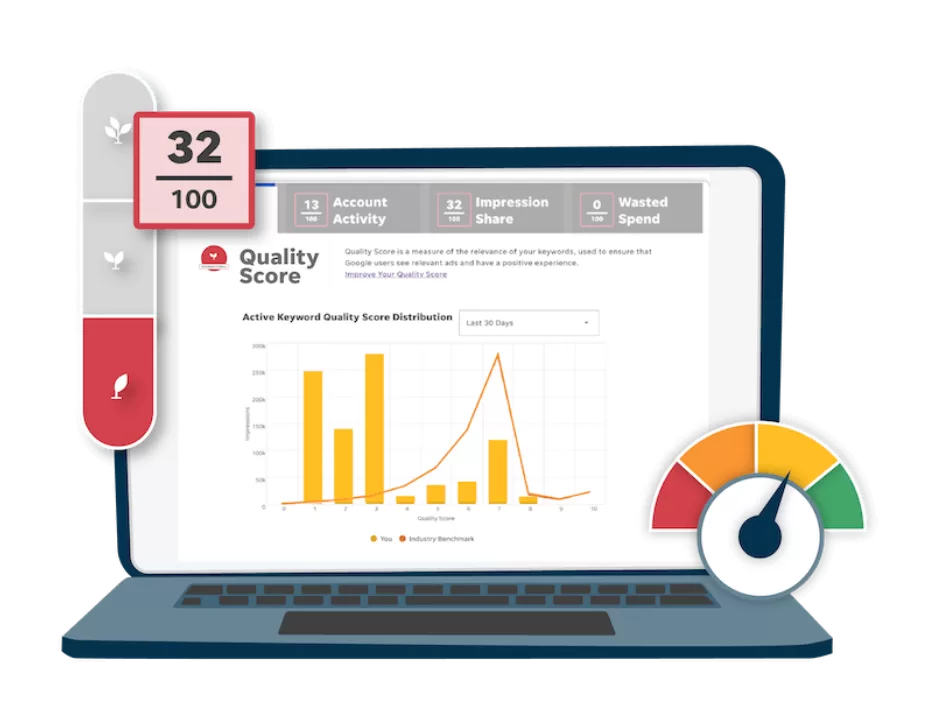
✴️ If you’re not totally satisfied with your search ad results, try the Free Google Ads Performance Grader to get a report card with tips on how to improve.
Search advertising benchmark data deep dive
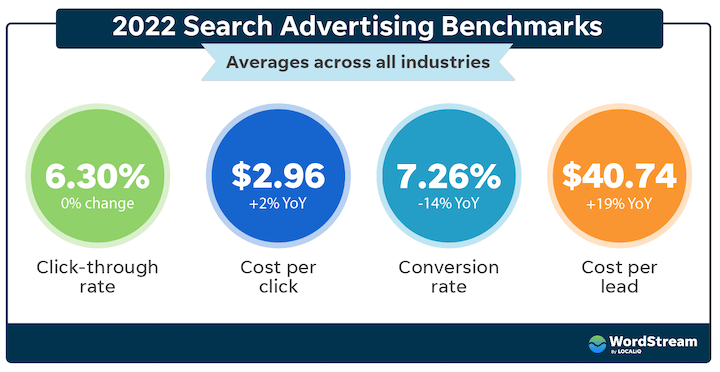
So, you know that costs are up and the reasons why—but what defines a “high” cost? What should you strive for in lowering yours? Well, let’s start with the overall averages for Google Ads in 2022:
- Average click-through rate: 6.30%
- Average cost per click: $2.96
- Average conversion rate: 7.26%
- Average cost per lead: $40.74
But while overall averages help us to see broader trends, each of these metrics varies widely when you drill down by industry. So in the data that follows, we provide industry-specific data, along with more insights and tips, to help you better understand and improve your performance in relation to your competitors.
Click to jump to a specific metric:
Note that you can find all the charts in this report grouped together in our Online Advertising Benchmarks hub page.
Average click-through rate in Google Ads, 2022
Click-through rate is the percentage of ad impressions that result in a click, and helps to indicate how relevant your ad is to the audience it’s reaching. A click-through rate of 1% means that 1 out of every 100 people who see your ad click on it.
Click-through rate is important because it is used to determine your expected click-through rate, which is factored into your Quality Score, which impacts your cost per click.
The average click-through rate for Google Ads in 2022 is 6.30%.
Industries with the lowest click-through rates include Apparel/Fashion/Jewelry, Shopping/Collectibles/Gifts, and Furniture at 2-4%. Furniture and Apparel had the lowest CTRs last year, while Shopping/Collectibles/Gifts was further up on the list.
Industries with the highest average click-through rates are the same as last year: Arts/Entertainment, Sports/Recreation, and Travel—all above 10%.
The variation in CTRs can likely be attributed to differences in user intent and decision-making depending on what industry they’re shopping in. For example, in the Arts/Entertainment category, a person seeking out a specific show or venue may be more inclined to click through on a result, while in the Apparel/Fashion/Jewelry category, a person shopping for shirts may do more browsing.
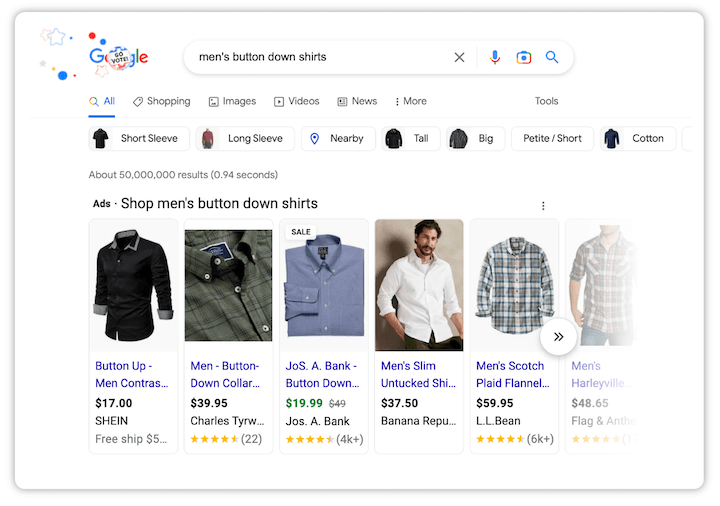
Plus, product searches tend to return more ad results per page (up to 30 Shopping ads on desktop and up to 15 on mobile), which could lead to lower CTR per ad; and the product photos allow a user to decide without clicking whether the product is what they want.
Average click-through rate: YoY
Year over year, 78% of the industries in this report saw an increase in CTR. However, in aggregate for all industries in total, there was no change in CTR.
Industries with the biggest decreases in CTR include Shopping/Collectibles/Gifts (-51%), Apparel/Fashion/Jewelry (-23%), and Arts/Entertainment (-17%). However, Arts/Entertainment is an outlier to begin with, so while it had a significant drop, it still had (and has historically had) the highest CTR of all the industries we looked at.
Industries with the biggest increases in CTR include Career/Employment (+56%), Attorneys/Legal (+32%), and Sports/Recreation (+32%).
How to improve your click-through rate
If you’re seeing lower click-through rates than your industry average, take a look at your ad copy and targeting. Are there other features, benefits, or emotional tones you can try out? Is the messaging highly relevant to not just the keyword, but also the searcher? Keep in mind that while higher CTR can bring down cost per click, it will increase cost per lead if those clicks aren’t relevant, so you may want to revisit your keyword list to make sure they’re truly relevant to your business. You can find more strategies to improve your click-through rate here.
Average cost per click in Google Ads, 2022
How much you pay for a given click on your ad is determined in real time by a complex formula that takes into account the competition level of the keyword, your bid, your competitors’ bids, and your ad’s quality. You can learn more in our Google Ads auction infographic.
Your average cost per click, however, is determined by dividing total campaign spend by total number of clicks. As such, higher click-through rates are typically associated with lower costs per click.
The average cost per click in Google Ads in 2022 is $2.96.
✴️ Get the PDF of this report here >> Google Ads Benchmarks Report
Industries with the lowest average cost per click (closer to $1) include Arts/ Entertainment, Apparel/Fashion/Jewelry, and Sports/Recreation. These industries have consistently low CPCs due to their high click-through rates, although Apparel has been closer to $2 or $3 in years past.
Industries with the highest average cost per click ($6-$8) are also consistent with years past, as they tend to have lower click-through rates: Attorneys/Legal Services, Dentists/Dental Services, and Home/Home Improvement.
Average cost per click, YoY
Year over year, 57% of the industries in this report saw an increase in cost per click, with an average overall increase of 2%. Tinuiti also found an increase in cost per click of 7% YoY in its Q3 report.
The most significant decreases were in Apparel/Fashion/Jewelry (-53%), Education/Instruction (-27%), and Shopping/Collectibles/Gifts (-26%). As mentioned earlier, CTR and CPC are often inversely correlated, but of these three industries, only Education/Instruction had an increase in CTR year over year.
The industries with the largest increases in cost per click were Travel (+15%) and Arts/Entertainment (+44%). Similar to the above, only the former increased in CTR (-18%) while the latter decreased (-17%). We’ll talk more about what else could be causing these changes later.
How to improve your cost per click
If your cost per click is higher than what you’re seeing for your industry, you may need to make some improvements in your keyword-ad-landing page relevancy. This will help to improve your Quality Score, which can lower your cost per click. Remember, though, that while high- intent keywords are more expensive, they are often more valuable to your business and may be worth the higher cost per click. You can learn more ways to lower your cost per click here.
Average conversion rate in Google Ads, 2022
Conversion rate is the percentage of clicks on your ad that actually convert, where a conversion is the completion of the call to action of the ad, such as a purchase or form-fill.
The average conversion rate for Google Ads in 2022 is 7.26%.
Industries with the lowest average conversion rates are the same as last year: Apparel/Fashion/Jewelry, Furniture, and Real Estate at 1-3%.
Those with the highest average conversion rates include Dentists/Dental Services, Automotive—Repair/Service/Parts, and Physicians/Surgeons—also the same as last year. Higher conversion rates are typical for these industries as their conversion actions tend to be lower-friction than those in the above three industries: It’s much easier for a consumer to call or contact a business to book an appointment that they could cancel than it is to buy a piece of furniture or jewelry.
Average conversion rate YoY
Year over year, 91% of industries saw a decrease in conversion rate. The average overall decrease is -14%.
The only two industries that saw small increases in conversion rates were Finance/Insurance (+2%) and Education/Instruction (+3%).
The biggest drops in conversion rate were in Apparel/Fashion/Jewelry (-68%), Arts/Entertainment (-38%), and Shopping/Collectibles/Gifts (-33%).
How to improve your conversion rate
If your conversion rates are underperforming for your industry, check your landing pages. Are they optimized for mobile? Do they clearly state the benefits of your product/service and make it easy for the user to take the action? You can find more landing page optimization tips here.
If your landing pages are optimized, you may then want to make sure your ads and offers are tightly aligned with the intent of the keyword and your audience. You can learn more in our tips to improve conversion rates.
Average cost per lead in Google Ads, 2022
Cost per lead is the total cost of a campaign divided by the total number of conversions. It’s also known as cost per action, cost per conversion, and cost per acquisition.
The average cost per lead for Google Ads in 2022 is $40.74.
Industries with the lowest average cost per lead include Automotive Repair/Service/Parts, Physicians/Surgeons, and Sports/Recreation—at $19-24. These industries had the lowest CPLs last year as well. For the first two, the low CPL can be attributed to high conversion rates; Sports/Rec has a relatively low conversion rate but its high CTR leads to lower cost per click which can also keep CPL down.
Those with the highest average cost per lead were the same as last year: Attorneys/Legal Services, Furniture, and Business Services—at $87 and above.
Average cost per lead YoY
Year over year, 91% of industries saw an increase in cost per lead. The overall average increase is 19%
The only two industries that saw a decrease in cost per lead include Education/Instruction (-29%) and Finance/Insurance (-2%).
The industries with the biggest increases in cost per lead include Arts/Entertainment (+134%), Travel (+69%), and Furniture (+54%).
How to improve your cost per lead
If you’re looking to bring down your cost per lead, you’ll need to increase lead volume and/or lower your cost per click (using our tips above).
You can also make adjustments to your bids and budgets. For example, you may allocate more of your budget to campaigns with lower CPAs, or adjust your bids within a campaign to be higher for times of the day or devices that convert higher. You can find more ways to lower your CPL here.
If you're not totally satisfied with your search ad results, try the Google Ads Performance Grader to get a free report card with tips on how to improve.
About the data
This report is based on a sample of 79,455 North American-based LOCALiQ client campaign cycles in the outlined business categories that were running search ads between October 1, 2021 - September 30, 2022.
Our proprietary platform dynamically shifts budget between search channels on a campaign-by-campaign basis, but in aggregate, approximately 80-85% of budget is allotted to Google and 15-20% to Microsoft.
Each business category includes a minimum of 250 campaign cycles. All currency values are posted in USD.
You can find the charts from this report as well as our previous benchmark data in interactive format in our Online Advertising Benchmarks page.
Mobile-friendly charts
Average Google Ads click-through rate in 2022
| Business Category | Avg Click-Through Rate in Google Ads, 2022 |
|---|---|
| Animals & Pets | 7.62% |
| Apparel / Fashion & Jewelry | 2.24% |
| Arts & Entertainment | 16.29% |
| Attorneys & Legal Services | 4.71% |
| Automotive -- For Sale | 8.15% |
| Automotive -- Repair, Service & Parts | 5.75% |
| Beauty & Personal Care | 6.16% |
| Business Services | 5.51% |
| Career & Employment | 6.41% |
| Dentists & Dental Services | 5.15% |
| Education & Instruction | 8.51% |
| Finance & Insurance | 8.88% |
| Furniture | 3.49% |
| Health & Fitness | 6.39% |
| Home & Home Improvement | 3.95% |
| Industrial & Commercial | 5.51% |
| Personal Services (Weddings, Cleaners, etc.) | 7.96% |
| Physicians & Surgeons | 7.00% |
| Real Estate | 8.85% |
| Restaurants & Food | 8.37% |
| Shopping, Collectibles & Gifts (General) | 2.45% |
| Sports & Recreation | 11.69% |
| Travel | 10.29% |
Average Google Ads cost per click in 2022
| Business Category | Avg Cost Per Click in Google Ads, 2022 |
|---|---|
| Animals & Pets | 2.48 |
| Apparel / Fashion & Jewelry | 1.04 |
| Arts & Entertainment | 0.85 |
| Attorneys & Legal Services | 8.46 |
| Automotive -- For Sale | 1.89 |
| Automotive -- Repair, Service & Parts | 2.71 |
| Beauty & Personal Care | 3.42 |
| Business Services | 3.80 |
| Career & Employment | 3.43 |
| Dentists & Dental Services | 6.69 |
| Education & Instruction | 2.68 |
| Finance & Insurance | 3.41 |
| Furniture | 2.02 |
| Health & Fitness | 3.21 |
| Home & Home Improvement | 5.74 |
| Industrial & Commercial | 3.50 |
| Personal Services (Weddings, Cleaners, etc.) | 2.97 |
| Physicians & Surgeons | 3.17 |
| Real Estate | 1.51 |
| Restaurants & Food | 1.49 |
| Shopping, Collectibles & Gifts (General) | 1.54 |
| Sports & Recreation | 1.15 |
| Travel | 1.39 |
Average Google Ads conversion rate in 2022
| Business Category | Average Conversion Rate in Google Ads, 2022 |
|---|---|
| Animals & Pets | 9.43% |
| Apparel / Fashion & Jewelry | 1.20% |
| Arts & Entertainment | 3.34% |
| Attorneys & Legal Services | 7.56% |
| Automotive -- For Sale | 5.47% |
| Automotive -- Repair, Service & Parts | 13.65% |
| Beauty & Personal Care | 7.88% |
| Business Services | 4.37% |
| Career & Employment | 4.59% |
| Dentists & Dental Services | 11.73% |
| Education & Instruction | 6.39% |
| Finance & Insurance | 5.56% |
| Furniture | 2.21% |
| Health & Fitness | 8.49% |
| Home & Home Improvement | 10.73% |
| Industrial & Commercial | 8.41% |
| Personal Services (Weddings, Cleaners, etc.) | 9.10% |
| Physicians & Surgeons | 13.94% |
| Real Estate | 3.07% |
| Restaurants & Food | 5.50% |
| Shopping, Collectibles & Gifts (General) | 3.37% |
| Sports & Recreation | 4.86% |
| Travel | 3.77% |
Average Google Ads cost per lead in 2022
| Business Category | Avg Cost Per Lead in Google Ads, 2022 |
|---|---|
| Arts & Entertainment | 25.46 |
| Physicians & Surgeons | 22.74 |
| Automotive -- Repair, Service & Parts | 19.85 |
| Animals & Pets | 26.25 |
| Sports & Recreation | 23.57 |
| Travel | 36.78 |
| Restaurants & Food | 27.18 |
| Personal Services (Weddings, Cleaners, etc.) | 32.66 |
| Health & Fitness | 37.79 |
| Automotive -- For Sale | 34.53 |
| Real Estate | 49.25 |
| Industrial & Commercial | 41.60 |
| Shopping, Collectibles & Gifts (General) | 45.85 |
| Beauty & Personal Care | 43.39 |
| Home & Home Improvement | 53.50 |
| Dentists & Dental Services | 57.02 |
| Career & Employment | 74.56 |
| Education & Instruction | 41.88 |
| Apparel / Fashion & Jewelry | 86.41 |
| Furniture | 91.47 |
| Finance & Insurance | 61.38 |
| Business Services | 87.04 |
| Attorneys & Legal Services | 111.86 |

Meet The Author
Kristen McCormick
Kristen is the Head of Marketing at Hatch, a customer communication platform for service-based businesses. She was previously the Senior Managing Editor at WordStream. Her cat Arnold has double paws on every paw, and she finds life to be exponentially more delightful on a bicycle.