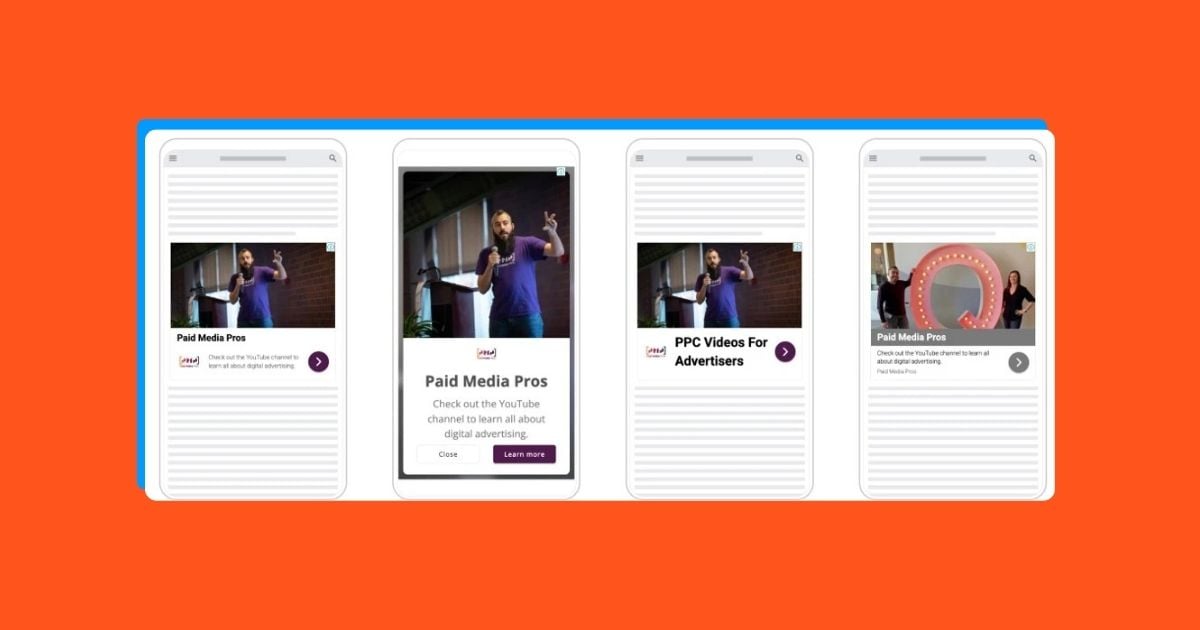
A picture (or a gif, or a video…you get the idea) is worth a thousand words, which is partly why display ads are such a valuable strategy for so many businesses. In fact, 74% of small businesses are satisfied with their display advertising results.
However, like all digital marketing strategies, it comes with challenges. Nailing down display ad campaign performance can be tricky. Since these media-based ads show passively across sites as people surf online, they pack on impression numbers quickly.
To help navigate this lucrative but complex channel, we analyzed over 60,000 LocaliQ display and video advertising campaigns from two different data sources to bring you our first-ever Display & Video Advertising Benchmarks, including performance averages for key metrics like click-through rate, cost per click, cost per lead, and viewability.
As mentioned, the data is split two ways: industry benchmarks covering display ads running across properties like Google, Microsoft, and YouTube, then overall performance averages for display ads running solely across the USA TODAY Network.
You can use these benchmarks to gauge how your display ads are performing and find out where you may need to improve—whether it be your audience targeting or display ad creative.
Let’s get into it!
Contents
- How to read this data
- Display and video ads benchmarks by industry
- High-impact display ads benchmarks
- Video display ads benchmarks
- Native display ads benchmarks
- Tips for the best display ads
🏃 On the go? Take this data with you! Download our free 2026 display and video ads benchmarks report here.
How to read our display and video ads benchmarks data
This report contains our new display and video ads benchmark data to help you better understand and maximize your campaign performance and budget. A couple of things to know about this report:
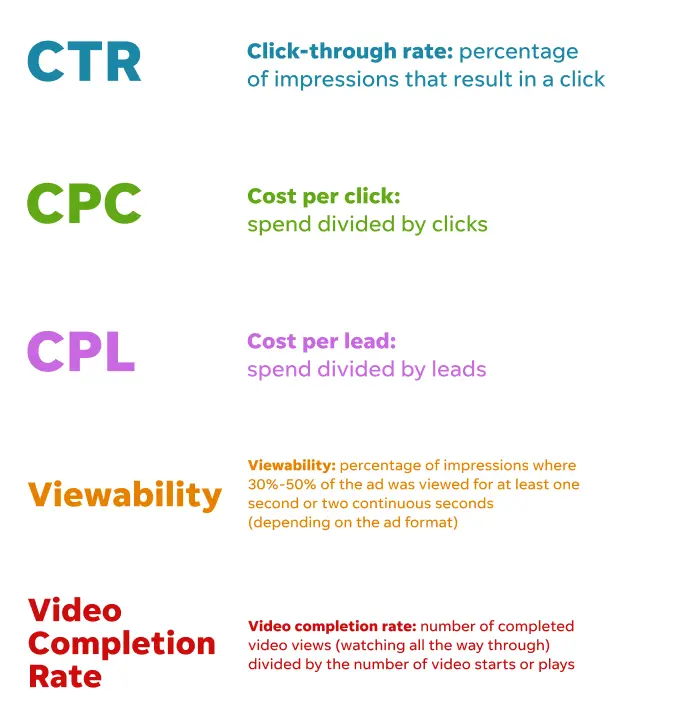
- Display ad industry metrics include average click-through rate, average cost per click, and average cost per lead.
- High-impact, video, and native display ads metrics include click-through rate, video completion rate, and viewability.
The metrics we chose to look at are specific to the nature of display ads. Display ads impact conversion rates indirectly (which is a measurement called view-through conversions), but they naturally have lower conversion rates attached to them directly, which is why we decided to omit that metric.
“My biggest advice when evaluating visual ad formats is to honor that they might not be delivering conversions themselves. Even when they do, they should not be held to the same benchmarks as search formats,” said Navah Hopkins, Ad Product Liaison at Microsoft.
Meanwhile, display ads yield tons of impressions, so even though their click-through rates look quite low if you compare them to other tactics like search ads, that can still equate to a lot of impactful clicks in the grand scheme of impressions versus clicks.
“Most people aren’t going to immediately click a display ad. They’ll come back to your site directly, weeks or months later, when they need you,” said Greg Carter, Vice President of Marketing at Clutch.
Ultimately, you want your display ads to get seen (or watched) and turn into real results, which is why we included viewability, video completion rate, cost per click, and cost per lead.
Display and video ads benchmarks by industry
For our first round of display ads benchmarks, we’ll look at click-through rate, cost per click, and cost per lead for standard display campaigns broken down by industry. These ads run on over 350 exchanges, networks, and publishers, including Google, YouTube, Meta, and Yahoo, and include multiple formats, such as banner ads, video, and more.
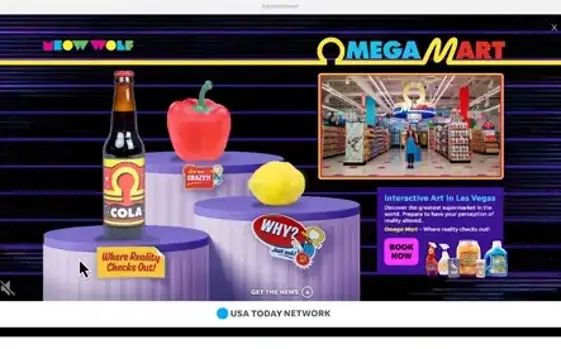
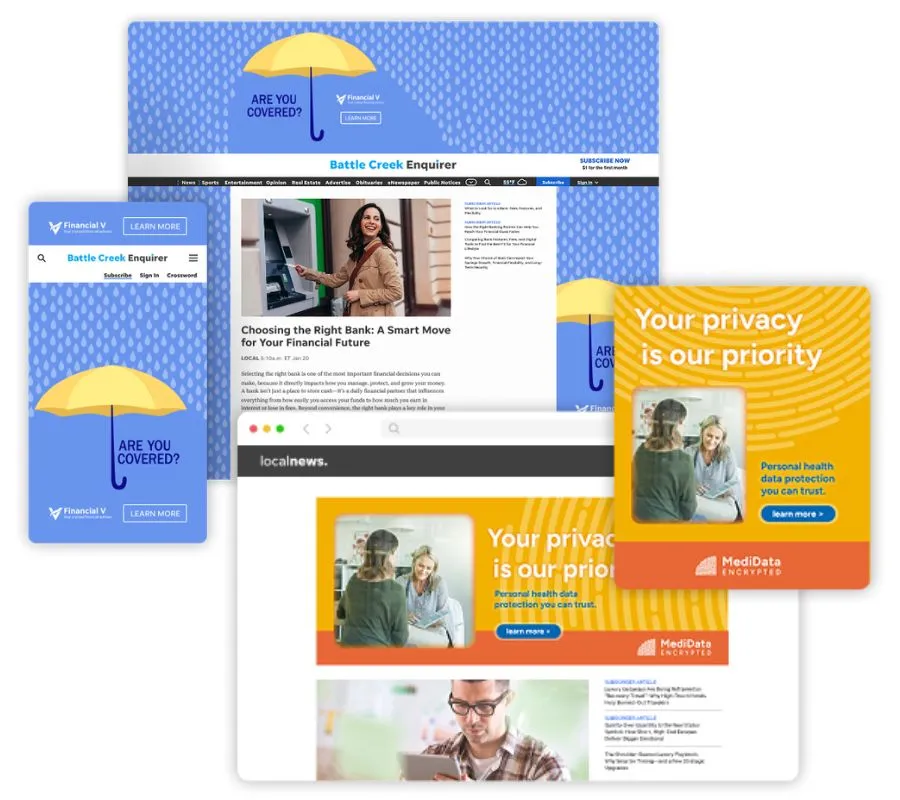
Here are some examples of these types of display ads in the wild.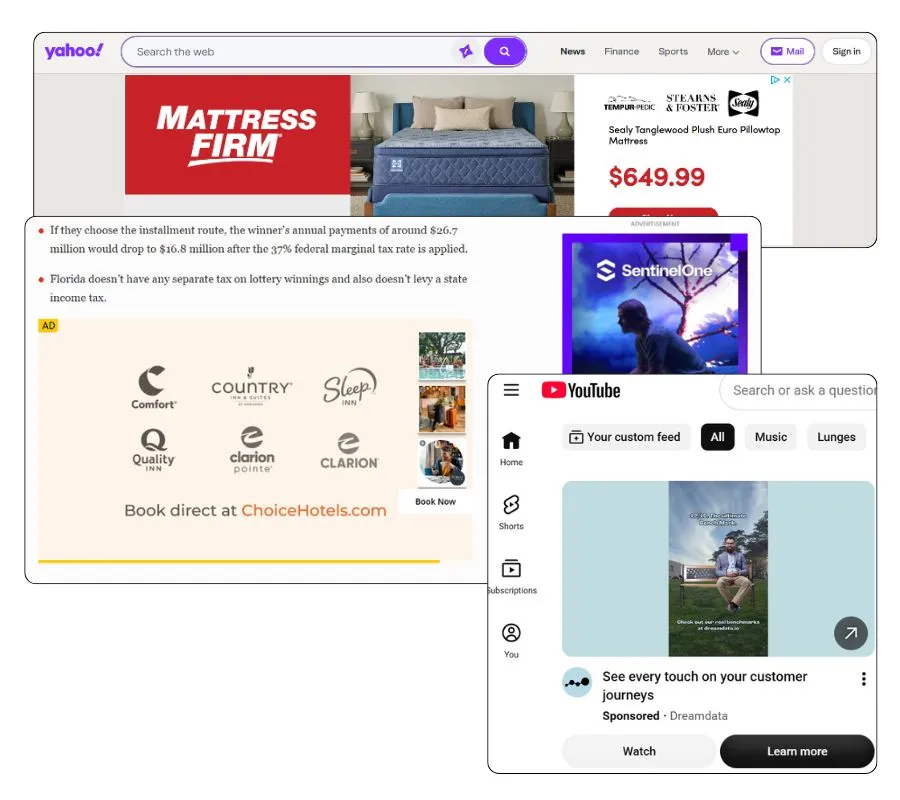
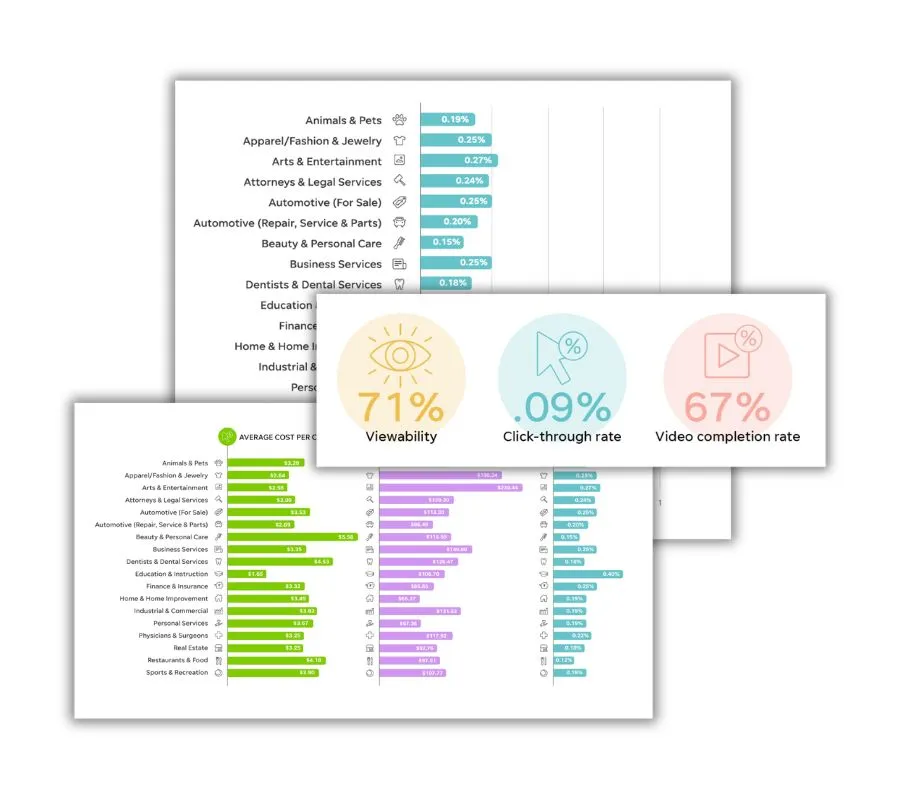
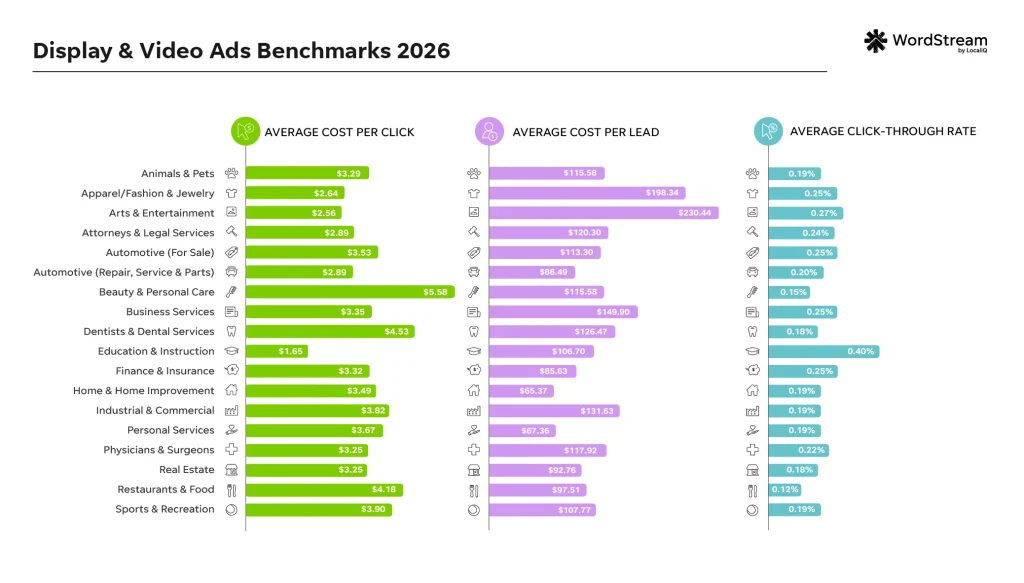
Here are the display and video ads benchmarks for cost per click, cost per lead, and click-through rate for each industry.
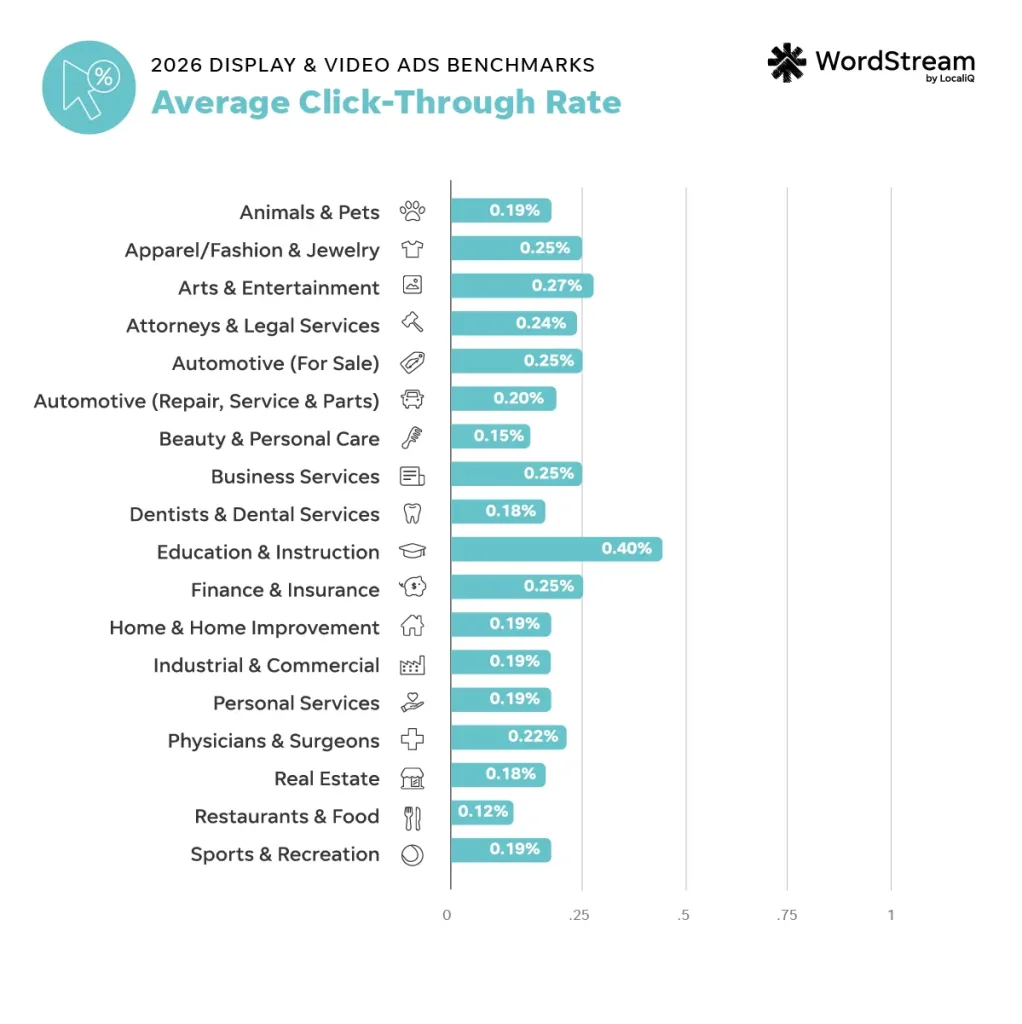
While click-through rate isn’t a make-or-break metric for display ads (because they’ll naturally yield way more impressions than clicks), it can be an initial indicator of how enticing or clickable your image or video creative is.
| Business category | Average click-through rate |
| Animals & Pets | 0.19% |
| Apparel / Fashion & Jewelry | 0.25% |
| Arts & Entertainment | 0.27% |
| Attorneys & Legal Services | 0.24% |
| Automotive — For Sale | 0.25% |
| Automotive — Repair, Service & Parts | 0.20% |
| Beauty & Personal Care | 0.15% |
| Business Services | 0.25% |
| Dentists & Dental Services | 0.18% |
| Education & Instruction | 0.40% |
| Finance & Insurance | 0.25% |
| Home & Home Improvement | 0.19% |
| Industrial & Commercial | 0.19% |
| Personal Services | 0.19% |
| Physicians & Surgeons | 0.22% |
| Real Estate | 0.18% |
| Restaurants & Food | 0.12% |
| Sports & Recreation | 0.19% |
The industry with the highest click-through rate for display ads was Education and Instruction at 0.40%, followed by Arts and Entertainment at 0.27%. Arts and Entertainment is a very visual industry to begin with, so it makes sense that people would be more likely to click on those ads.
| Business category | Average cost per click |
| Animals & Pets | $3.29 |
| Apparel / Fashion & Jewelry | $2.64 |
| Arts & Entertainment | $2.56 |
| Attorneys & Legal Services | $2.89 |
| Automotive — For Sale | $3.53 |
| Automotive — Repair, Service & Parts | $2.89 |
| Beauty & Personal Care | $5.58 |
| Business Services | $3.35 |
| Dentists & Dental Services | $4.53 |
| Education & Instruction | $1.65 |
| Finance & Insurance | $3.32 |
| Home & Home Improvement | $3.49 |
| Industrial & Commercial | $3.82 |
| Personal Services | $3.67 |
| Physicians & Surgeons | $3.25 |
| Real Estate | $3.25 |
| Restaurants & Food | $4.18 |
| Sports & Recreation | $3.90 |
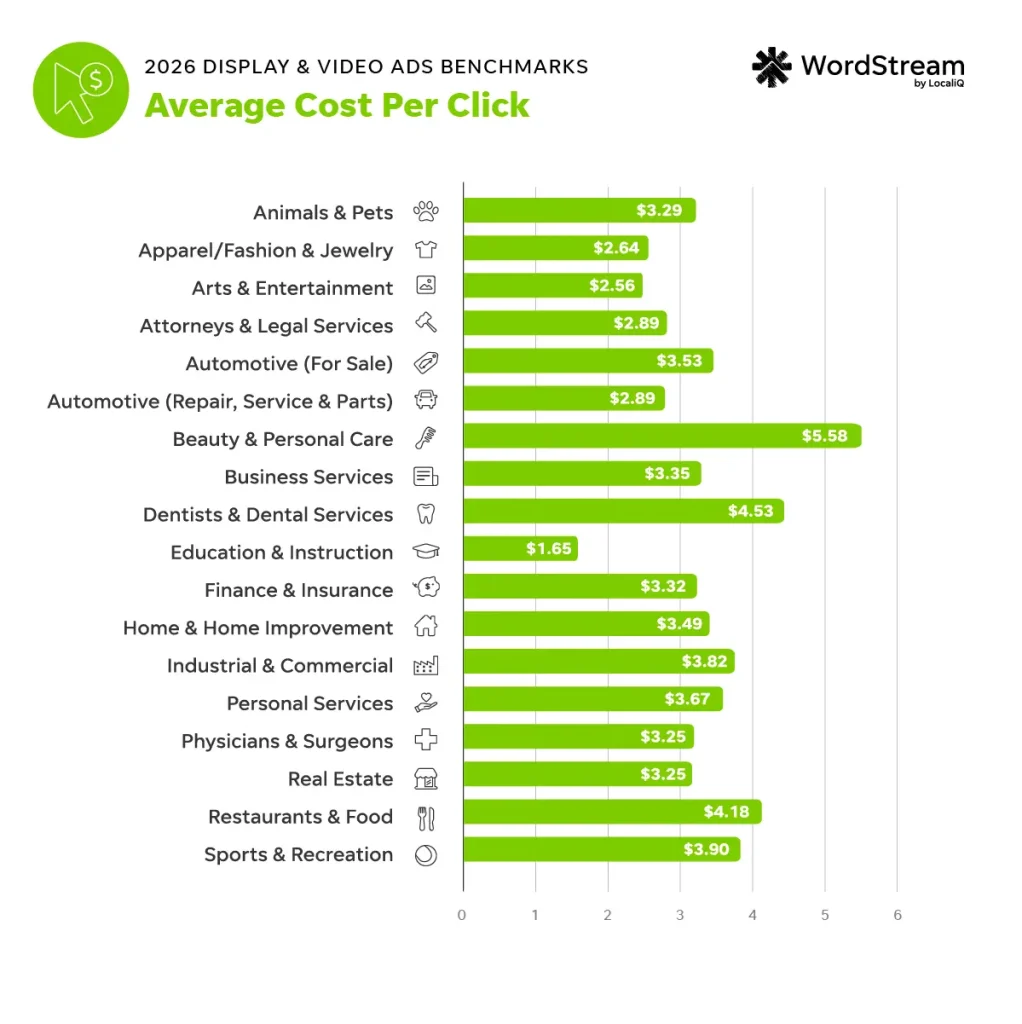
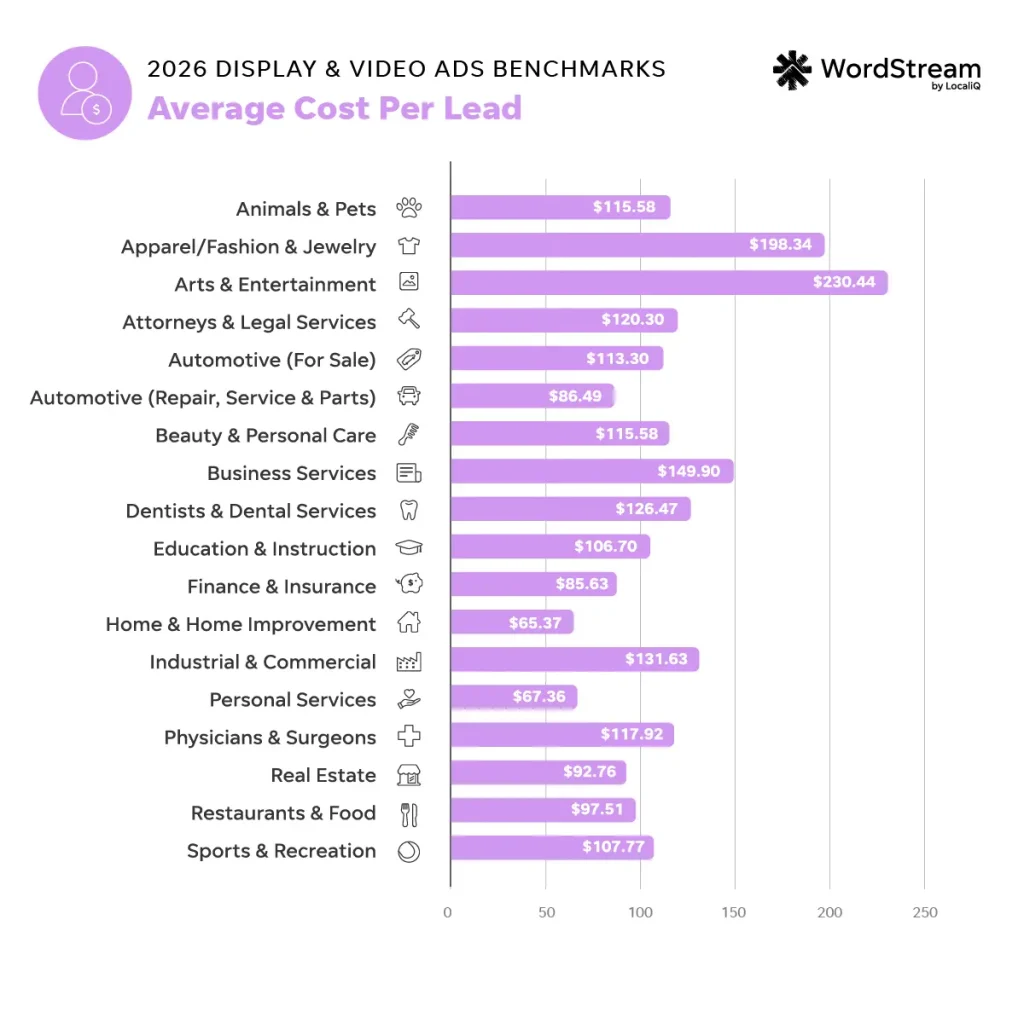
Costs per click and lead for display ads vary. Typically, clicks are cheaper for this ad type compared to search ads. Beauty and Personal Care had the highest cost per click at $5.58, which checks out, as this particular industry is extremely competitive.
| Business category | Average cost per lead |
| Animals & Pets | $115.58 |
| Apparel / Fashion & Jewelry | $198.34 |
| Arts & Entertainment | $230.44 |
| Attorneys & Legal Services | $120.30 |
| Automotive — For Sale | $113.30 |
| Automotive — Repair, Service & Parts | $86.49 |
| Beauty & Personal Care | $115.58 |
| Business Services | $149.90 |
| Dentists & Dental Services | $126.47 |
| Education & Instruction | $106.70 |
| Finance & Insurance | $85.63 |
| Home & Home Improvement | $65.37 |
| Industrial & Commercial | $131.63 |
| Personal Services | $67.36 |
| Physicians & Surgeons | $117.92 |
| Real Estate | $92.76 |
| Restaurants & Food | $97.51 |
| Sports & Recreation | $107.77 |
⚡ Want to optimize your Google display and video ads fast? Start with a free, instant account report using our Google Ads Grader!
High-impact display ads benchmarks
High-impact display ads running specifically on the USA TODAY Network show in larger, more visible placements across USA TODAY-owned sites. They tend to be full-screen, cinematic experiences. They can include GIFs and interactive, clickable features to grab lots of attention, and in turn, make a big impact on your business’s display advertising goals.’
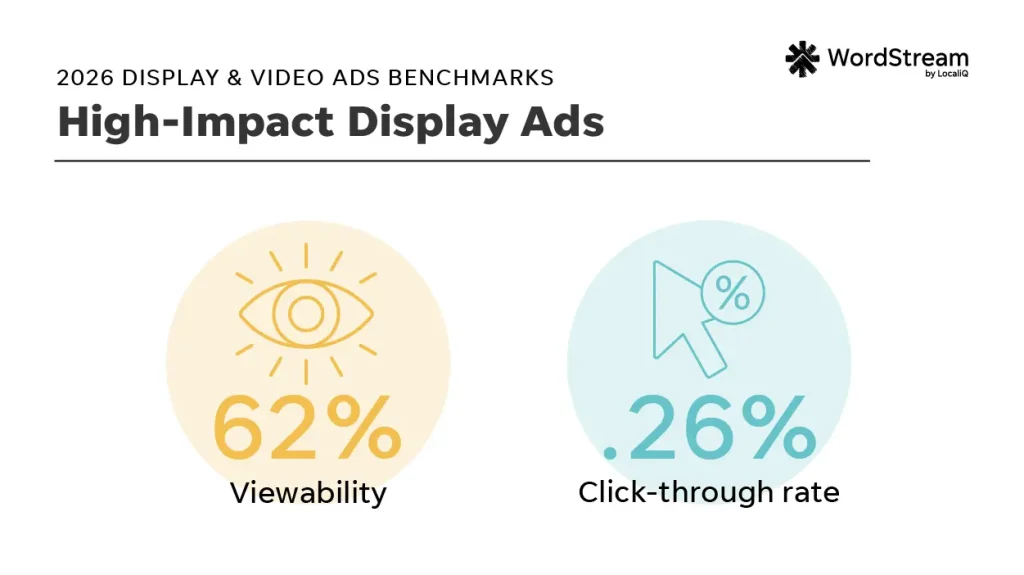
Here is how high-impact ads on the USA Today Network typically perform in 2026:
- The average viewability rate for high-impact display ads is 62%.
- The average click-through rate for high-impact display ads is 0.26%.
Video display ads benchmarks
Video display ads showing on the USA TODAY Network are playable ads that viewers can watch, replay, and click on. Video is the preferred ad format for many, with 75% of consumers making a purchase after watching a video ad in the last year.
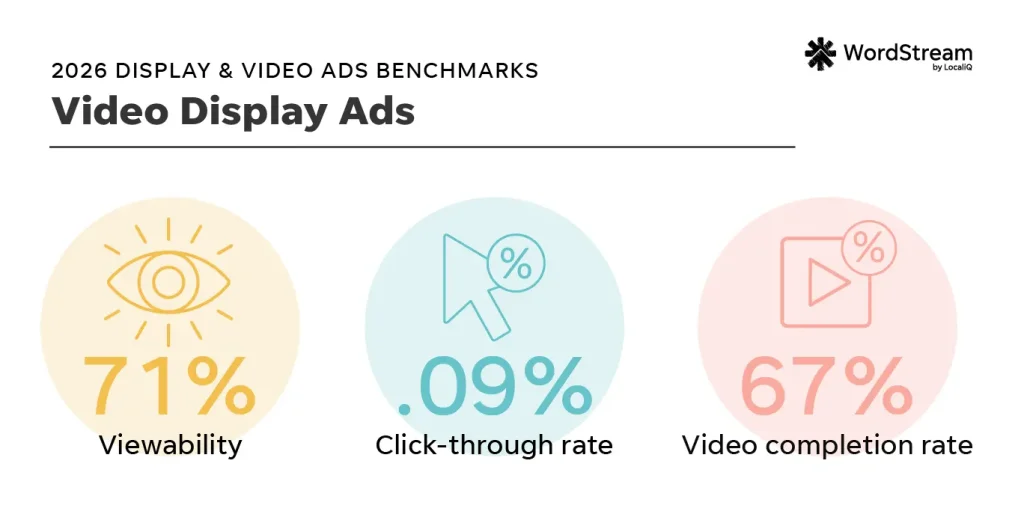
So, what results can you expect from a typical video ad in 2026? Here’s what we found.
- The average viewability rate for video ads is 71%.
- The average click-through rate for video ads is 0.09%.
- The average video completion rate of video ads is 67%.
A lower CTR isn’t a cause for concern with this ad type because viewers tend to watch the video, absorb the content, and move on. But video ads can make a memorable impression, and viewers are more likely to come back to your business’s offer later.
Native display ads benchmarks
Native display ads integrate your brand directly into the USA TODAY experience. These ads blend in across headline pages, articles, and newsletters, so your message seamlessly shows up in context where audiences are already engaged.

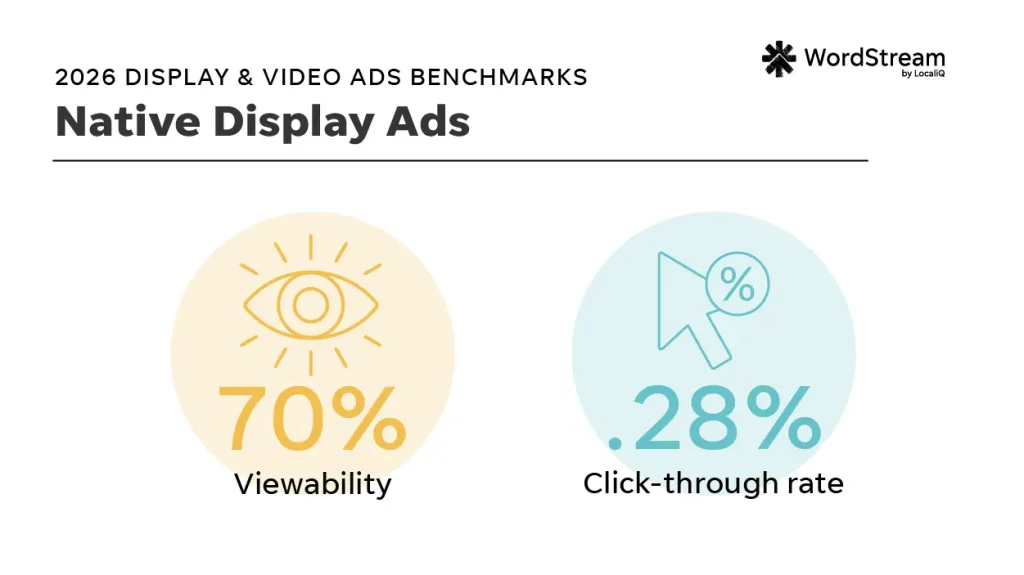
Native display ads had similar click-through rates and viewability rates to the other USA TODAY Network ads we looked at. In 2026:
- The average viewability rate for native display ads is 70%.
- The average click-through rate for native display ads is 0.28%.
Tips for the best display ads
Whether you’re new to display advertising or a seasoned display campaign veteran, this benchmark data can be a practical reference point when assessing and optimizing your strategy.
“I read these benchmarks as targets. I want to be above the number for my industry,” Greg said.
Ready to take your display and video ads to the next level? Here are some display advertising tips (based on this data) to help you get started.
1. Try a variety of placements
On average, all of the display ad types we covered in this report brought in a good number of clicks and views. For maximum reach, be sure to have display ad creative that’s flexible across major placements on the Google Display Network (including YouTube), Microsoft Audience Network, USA TODAY Network, and more.
“Display can add depth to your strategy—just simply getting in front of your target audience and reinforcing your position in their mind is deeply valuable,” said Brett McHale, Founder of Empiric Marketing.
2. Prioritize your display budgets when allocating ad spend
It can be easy to let your display campaigns fall by the wayside when planning your budgets, but it’s not that search ads are better than display or vice versa; they’re complementary to one another. Your display ads are part of your pre-marketing strategy, meaning you want them to be familiar with your business before it’s even time to buy the types of products and services you offer. This drives users to search for your business later.
“What makes display advertising so useful is that it can be leveraged at the beginning of the customer journey to inspire awareness, just as easily as it can remind a customer to complete their transaction towards the end with remarketing,” Navah said.
So, while you can factor in that display ads have a lower average CPC than search ads, you’ll want to treat budget allocations similarly. With display ads, you’re often paying per view or impression, rather than per click. You’ll need a competitive budget to get seen as much as possible.
“One way to improve display performance is to have a larger budget allocated for these types of campaigns. More budget means more impressions, and more data to optimize with,” said Rhett Chassereau, Supervisor of Programmatic Buying & Optimization at USA TODAY Co.
3. Continuously test different creative elements
While you’ll want to leverage multiple placement types across networks in your display strategy, you should also constantly test various creative elements. For example, see if your audience is more receptive to certain color schemes, image types, calls to action, and more.
“Cycle in new creative and make multiple copy variations for each. Launch a number of ads and find out which one performs the best,” Brett said.
“From there, you can take the top-performing and make more variations of them,” he added.
Like anything with PPC advertising, testing your display ads will be a bit of a balancing act that requires both patience and agility.
“Give the channel time, then be proactive about your display ad creative. Judge individual ads fast and rotate them out as soon as the data is clear. But judge overall display campaigns more cautiously, because they’re a brand play that won’t necessarily pay back on a short timeline,” Greg said.

4. Use AI to scale your display ads
AI, when used thoughtfully, can help you quickly scale your display campaigns. For instance, it can help you brainstorm test ideas or quickly duplicate and tweak current creative your team has designed. Just be sure to give any AI-generated display assets a final, manual edit before you set them live to avoid any glaring AI fails or off-brand elements.
What these display and video ads benchmarks mean for your business
Whatever your industry, you can make display ads work for your business. Display ads help you reach a wide but highly qualified audience. You can remarket to potential customers already interested in your business and pre-market to brand-new potential customers, too. Just be ready to flex your display strategy according to test results and placement trends, so your display ads always catch the attention you’re looking to grab.
For more help making the most of your display ads, see how our solutions can maximize your campaign strategy!
About the data
The display and video ad industry data is pulled from 7,074 LocaliQ customer display advertising campaigns running from April 2025 through June 2026. High-impact, video, and native display ads benchmarks data is based on 55,798 location-based display advertising campaigns run on the USA TODAY Network between July 2025 and June 2026. “Averages” are technically median figures to account for outliers. All currency values are posted in USD.
About the WordStream Blog
We've been a trusted source of data, news, and strategy for over 15 years. All of our content is written and reviewed by real people: a dedicated team of professionals with decades of combined experience in marketing and advertising for businesses of all sizes.


Add us as a preferred source on Google
Are you wasting money in Google Ads?

Meet The Author
Susie Marino
Susie is the Senior Content Marketing Specialist for WordStream and LocaliQ, where she uses her experience as a PPC consultant to share tips, tactics, and best practices in the ever-evolving marketing and advertising space. Susie’s work has been featured in publications such as Search Engine Land, MediaPost, Social Media Today, and others. Outside of work, Susie loves to get outside for some snowboarding or (once the cold weather melts away) hiking!