Google Ads Benchmarks for YOUR Industry [Updated!]
Whether you’re doing PPC for the first time or you’ve just signed a new client, it can be daunting to know whether or not you’re doing a good job. Sure, we all want to create unicorn ads that have highest CTRs and the best conversion rates, but what’s a good metric for one industry isn’t necessarily good for another. So what numbers should you be looking to beat in your industry?
Check out the Google Ads industry benchmarks our clients are seeing, including:
- Average click-through rate (CTR)
- Average cost per click (CPC)
- Average conversion rate (CVR)
- Average cost per action (CPA)
You’ll find averages across these ads metrics for twenty industries: Advocacy, Auto, B2B, Consumer Services, Dating & Personals, E-Commerce, Education, Employment Services, Finance & Insurance, Health & Medical, Home Goods, Industrial Services, Legal, Real Estate, Technology, and Travel & Hospitality.
✴️ Note: We update this data regularly!
Download the PDF of our latest Google Ads Benchmarks report here.
Average Click-Through Rate in Google Ads by Industry
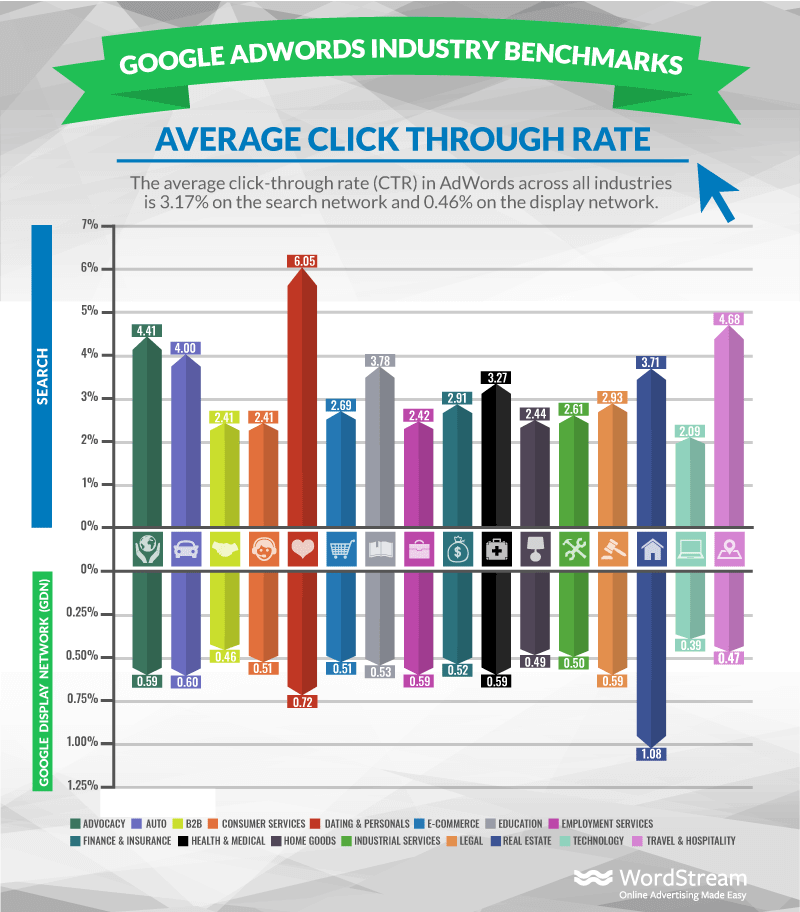
Dating and personal services really click with PPC – boasting an average search CTR of 6%! No doubt, it’s easy to write powerful emotional ad copy when your prospects are searching for love. Other industries with high search CTRs include Advocacy, Autos, and Travel.
When we first collected this data in 2015, legal services could struggle to attract attention on the SERP (with a relatively low average 1.35% CTR) – in large part due to advertising restrictions enforced by both Google and government organizations. Legal advertisers have improved their stats in the past few years!
As of 2018, the industries with the lowest average click-through rates including Technology, B2B, and Consumer Services.
The average click-through rate in Google Ads across all industries is 3.17% for search and 0.46% for display.
Both of these averages are higher than they were a couple of years ago: Good news for Ads advertisers and agencies!
Average Click Through Rate (CTR)
| Industry | Average CTR (Search) | Average CTR (GDN) |
|---|---|---|
| Advocacy | 4.41% | 0.59% |
| Auto | 4.00% | 0.60% |
| B2B | 2.41% | 0.46% |
| Consumer Services | 2.41% | 0.51% |
| Dating & Personals | 6.05% | 0.72% |
| E-Commerce | 2.69% | 0.51% |
| Education | 3.78% | 0.53% |
| Employment Services | 2.42% | 0.59% |
| Finance & Insurance | 2.91% | 0.52% |
| Health & Medical | 3.27% | 0.59% |
| Home Goods | 2.44% | 0.49% |
| Industrial Services | 2.61% | 0.50% |
| Legal | 2.93% | 0.59% |
| Real Estate | 3.71% | 1.08% |
| Technology | 2.09% | 0.39% |
| Travel & Hospitality | 4.68% | 0.47% |
Average Cost Per Click in Google Ads by Industry
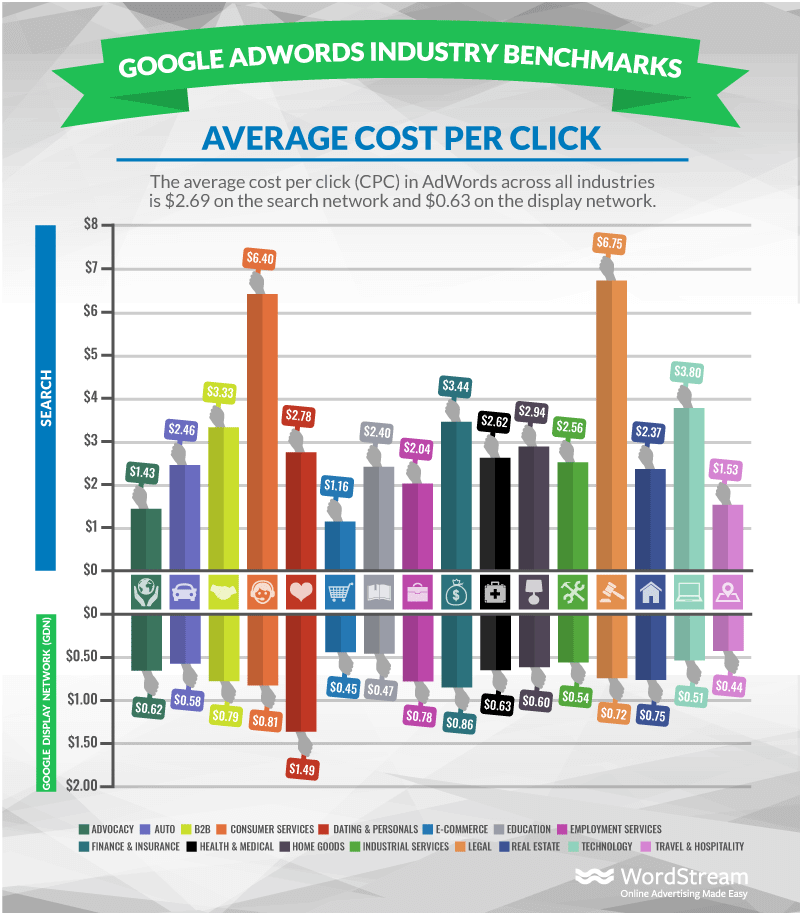
It’s no surprise that legal services have some of the highest CPCs among all Google ads on the search network. Both “Lawyer” and “Attorney” make the top 10 most expensive keywords on Google and on Bing. Average CPCs in the legal industry are over $6. Consumer services aren’t too far behind, with an average CPC of $6.40.
Advocacy and nonprofit groups are fortunate to have a cost per click under $2, likely as a result of the $2 max CPC bid Google Grant advertisers have to set on all of their keywords.
Most industries have pretty inexpensive CPCs on the Google Display Network. The only industry with costs per click over $1 on the Display network is Dating & Personals.
The average cost per click in google ads across all industries is $2.69 for search and $0.63 for display.
The news here is good too: These Google Ads costs have increased very little over the figures we found a couple of years ago (when the averages were $2.32 and $0.58 respectively).
Average Cost Per Click (CPC)
| Industry | Average CPC (Search) | Average CPC (GDN) |
|---|---|---|
| Advocacy | $1.43 | $0.62 |
| Auto | $2.46 | $0.58 |
| B2B | $3.33 | $0.79 |
| Consumer Services | $6.40 | $0.81 |
| Dating & Personals | $2.78 | $1.49 |
| E-Commerce | $1.16 | $0.45 |
| Education | $2.40 | $0.47 |
| Employment Services | $2.04 | $0.78 |
| Finance & Insurance | $3.44 | $0.86 |
| Health & Medical | $2.62 | $0.63 |
| Home Goods | $2.94 | $0.60 |
| Industrial Services | $2.56 | $0.54 |
| Legal | $6.75 | $0.72 |
| Real Estate | $2.37 | $0.75 |
| Technology | $3.80 | $0.51 |
| Travel & Hospitality | $1.53 | $0.44 |
Wondering how you measure up?
Grade your account with the Free Google Ads Performance Grader.
Average Conversion Rates in Google Ads by Industry
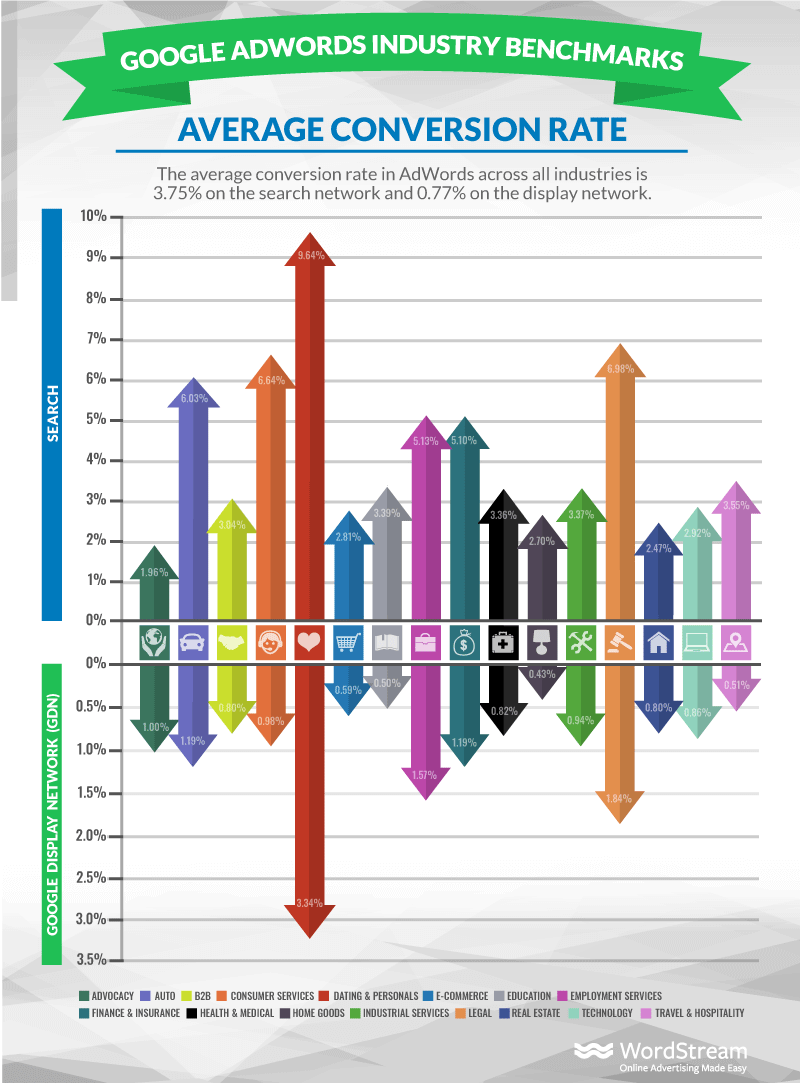
A couple of years ago, the Finance and Insurance industries were leading the pack when it came to conversion rates.
However, our newly updated data shows that the Dating & Personal industry is way out ahead now, with search conversion rates on average over 9%! Other standouts include the legal industries, consumer services, and autos.
In many of these cases, the best converting advertisers aren’t afraid to change their offer or their conversion flow to boost their conversion rates. Or they may be taking advantage of conversion-boosting tactics such as video landing pages.
Ecommerce clients may not have many options to change their offer and consequently suffer one of the poorer average conversion rates on both search and display. To boot, they often have gigantic inventories, which prevents doing fine-tuning on ad copy across all ecommerce keywords.
Brought to you by

Ready to grow your business?
Unlock the results you’re looking for with technology-backed solutions designed for small businesses and agencies.
While removing barriers to purchase will always be an important CRO tool to help ecommerce clients, Google Ads advertisers should focus on improving the performance of their keywords with high commercial intent to yield the most out of their search campaigns.
The average conversion rate in google ads across all industries is 3.75% for search and 0.77% for display.
Since the last time we compiled this data, search conversion rates have risen slightly, but display conversion rates have fallen slightly, perhaps a sign that display advertisers need to pay more attention to placements and audience optimization.
Average Conversion Rate (CVR)
| Industry | Average CVR (Search) | Average CVR (GDN) |
|---|---|---|
| Advocacy | 1.96% | 1.00% |
| Auto | 6.03% | 1.19% |
| B2B | 3.04% | 0.80% |
| Consumer Services | 6.64% | 0.98% |
| Dating & Personals | 9.64% | 3.34% |
| E-Commerce | 2.81% | 0.59% |
| Education | 3.39% | 0.50% |
| Employment Services | 5.13% | 1.57% |
| Finance & Insurance | 5.10% | 1.19% |
| Health & Medical | 3.36% | 0.82% |
| Home Goods | 2.70% | 0.43% |
| Industrial Services | 3.37% | 0.94% |
| Legal | 6.98% | 1.84% |
| Real Estate | 2.47% | 0.80% |
| Technology | 2.92% | 0.86% |
| Travel & Hospitality | 3.55% | 0.51% |
Average Cost Per Action in Google Ads by Industry
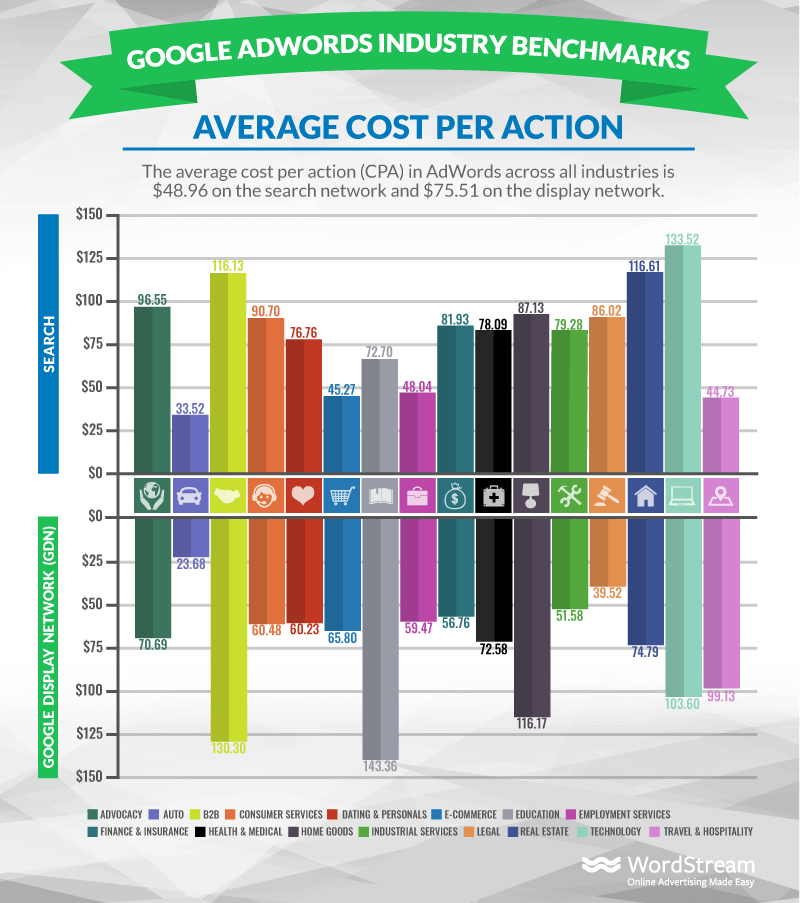
CPA’s have shifted quite a bit in the past couple of years. The lowest cost per action across industries is now autos, coming in at just $33 per action. B2B, real estate, and tech companies, on the other hand, confront average costs per action over $100.
We generally expect costs in advertising to rise over time, but the average CPA on the search network is actually lower now than it was a couple of years ago. Display CPA’s, however, have gone up a little bit.
The average CPA in google ads across all industries is $48.96 for search and $75.51 for display.
Average Cost Per Action (CPA)
| Industry | Average CPA (Search) | Average CPA (GDN) |
|---|---|---|
| Advocacy | $96.55 | $70.69 |
| Auto | $33.52 | $23.68 |
| B2B | $116.13 | $130.36 |
| Consumer Services | $90.70 | $60.48 |
| Dating & Personals | $76.76 | $60.23 |
| E-Commerce | $45.27 | $65.80 |
| Education | $72.70 | $143.36 |
| Employment Services | $48.04 | $59.47 |
| Finance & Insurance | $81.93 | $56.76 |
| Health & Medical | $78.09 | $72.58 |
| Home Goods | $87.13 | $116.17 |
| Industrial Services | $79.28 | $51.58 |
| Legal | $86.02 | $39.52 |
| Real Estate | $116.61 | $74.79 |
| Technology | $133.52 | $103.60 |
| Travel & Hospitality | $44.73 | $99.13 |
What Does It All Mean?
If you find yourself on the lower end of these numbers, that just means there’s plenty of room for improvement! Try running our free Google Ads Grader to diagnose exactly where your campaigns are failing when compared to peers in your industry. If you’re hitting these benchmarks – don’t stop and settle for average either! Always strive to be a unicorn by writing the best ad copy and creating landing page unicorns that convert better than anyone else!
Use these search advertising benchmarks to see how you stack up against your competitors and where you can improve. For help making sense of this data, check out our PPC metrics guide or our visual explanation on how Google Ads works You may also be interested in these:
- Home services advertising benchmarks
- Real estate advertising benchmarks
- Healthcare advertising benchmarks
Check out the full infographic below:

Data Sources:
This report is based on a sample of 14,197 US-based WordStream client accounts in all verticals (representing over $200 million in aggregate Google Ads spend) who were advertising on Google’s Search and Display networks between August 2017 and January 2018. Each industry includes at minimum 30 unique active clients. “Averages” are technically median figures to account for outliers. All currency values are posted in USD.
Frequently Asked Questions (FAQ)
Do these figures include branded keywords or just generic keywords?
The figures omit advertisers who were exclusively bidding on branded terms. Averages presented were median values to prevent a large advertiser with particularly good or bad performance from skewing the average.
Any accounting for the impact of fraud and bots on CTR?
The data was pulled directly from Google Ads, which does have provisions for omitting automated or fraudulent traffic, as opposed to Google Analytics. Additionally, reported averages are medians to prevent any skew from any account that may have artificially high CTRs due to automatic traffic.
Is this worldwide data?
The above data is reflective of a sample of US-based accounts. We have some international data on average costs per click around the world here.
How does search look with branded and non-branded segments?
While we didn’t specifically segment the brand and nonbranded search segments, those accounts that were exclusively on branded terms were omitted to prevent that upward skew.
Last Google Ads click conversion attribution?
All these conversion figures follow a last paid click attribution model.
How about people in the home improvement, bathroom remodeling, kitchen remodeling, and replacement window space? Which of these industries does that fall under?
Those are under the Home Goods industry.
Could you define “CPA”? Depending on industry or product, the action could be a sale, or just a newsletter sign-up. I managed many PPC accounts and every client had a different definition of an “action”.
Cost per action or cost per acquisition, but as you note, the exact definition of “action” is going to vary depending on the business.
I have some questions about how conversions and actions are defined by category (especially real estate) for calculating the CPA and CVR. Can you advise or connect me with someone who can answer?
These conversions are defined as the useful measure of success for each account. For retailers, that may be a sale – for others such as real estate that may be a form fill or a phone call.
Any sense of how these CPCs and CTRs compare to prior years? Curious how they might have changed as Google has changed their SEO/SEM formats and rankings.
Overall, these CTRs have risen and CPCs have fallen.
Wondering how you measure up?
Grade your account with the Free Google Ads Performance Grader.
FYI. Your implied CPM on google search is $57.42. I don’t think so. In general, I think you’re numbers skew more favorable to the search network than reality. Just sayin…
The averages here are the median of our client accounts. I’m happy to hear that you find that our clients are overperforming your expectations on the search network!
I wanted to clarify “conversion rate.” Is that percentage of people who click on the ad? Eg. 1.9% click on the ad, then 2.7% of that 1.9% make a purchase?
The conversion rate is the likelihood of someone completing the action we’re looking for them to do after clicking the ad. You can calculate conversion rate by taking the number of conversions by the number of clicks.
Why would conversion rate be higher than CTR? By definition CTR is always higher than conversion rate isnt it?
No. The total number of conversions will be lower than the total number of clicks, but the conversion RATE can be higher. For example, if only 1 out of 100 people click your ad, but every single person who clicks your ad converts, that’s a 1% click-through rate but a 100% conversion rate. The conversion rate is based on people who click, not the total # of people who saw the ad from the beginning.
Why is there a specific category for e-commerce? Would that not apply to all of the other categories?
Not all advertisers are ecommerce. Many are looking to provide services or lead generation for their business.
Could you just explain what you define the “Advocacy” industry as?
Advocacy groups aim to create support, awareness, or fundraising for a cause, policy, or organization.
Is search inclusive of shopping? Or is this text ads only?
Yes, shopping campaigns live on the search network.
Can you recommend PPC networks which are better than Google in terms of targeting and CTR?
Bing generally posts higher CTRs and CVRs, as well as lower CPCs and CPAs than Google. We have additional benchmarks for Bing here and Google Mobile Benchmarks – by Ad Type.




Comments
Please read our Comment Policy before commenting.