Featured Article
Landing Page Copywriting: How to Write Copy That Converts
If your landing page copy isn't landing, these tips, steps, and template will help.


Landing Page Copywriting: How to Write Copy That Converts
If your landing page copy isn't landing, these tips, steps, and template will help.
How to Do Prompt-Based Keyword Research to Show Up Better in AI Results
Learn how to adapt keyword research for AI search by focusing on conversational intent and the way people actually prompt tools like ChatGPT.

How Much Does Google Ads Cost?
All of the benchmarks, factors, and tips you need to determine your Google Ads costs.

Nostalgia Marketing: When & How to Use It for More Compelling Campaigns
From brain science to brand trust—learn the psychology of nostalgia marketing and how to apply it the right way.

Query Fan-Out: What It Is & Why It Matters for AI Visibility
Query fan-out is important to understand if you want to get found in AI results. Get tips and tools to optimize for query fan-out.
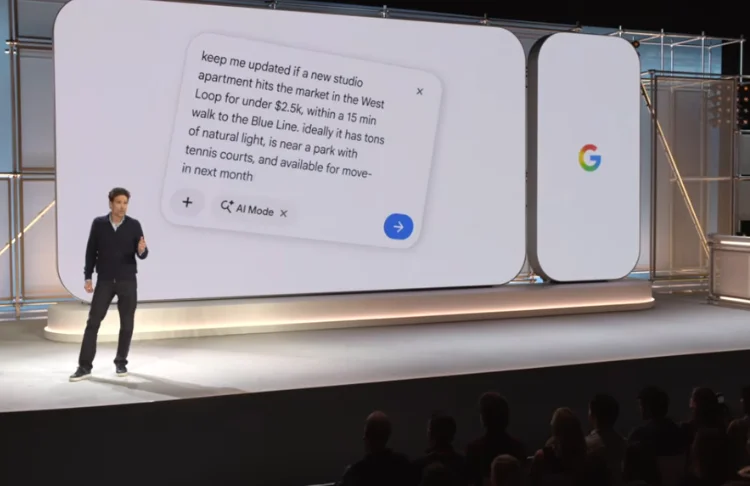
Google Marketing Live 2026: Top 11 Announcements & Early Reactions
See the most important announcements from Google Marketing Live 2026 and what marketers have to say about them.

How AI Expands Your Competitor Set & What to Do About It
AI has expanded the competitive landscape. Here's what you need to know.
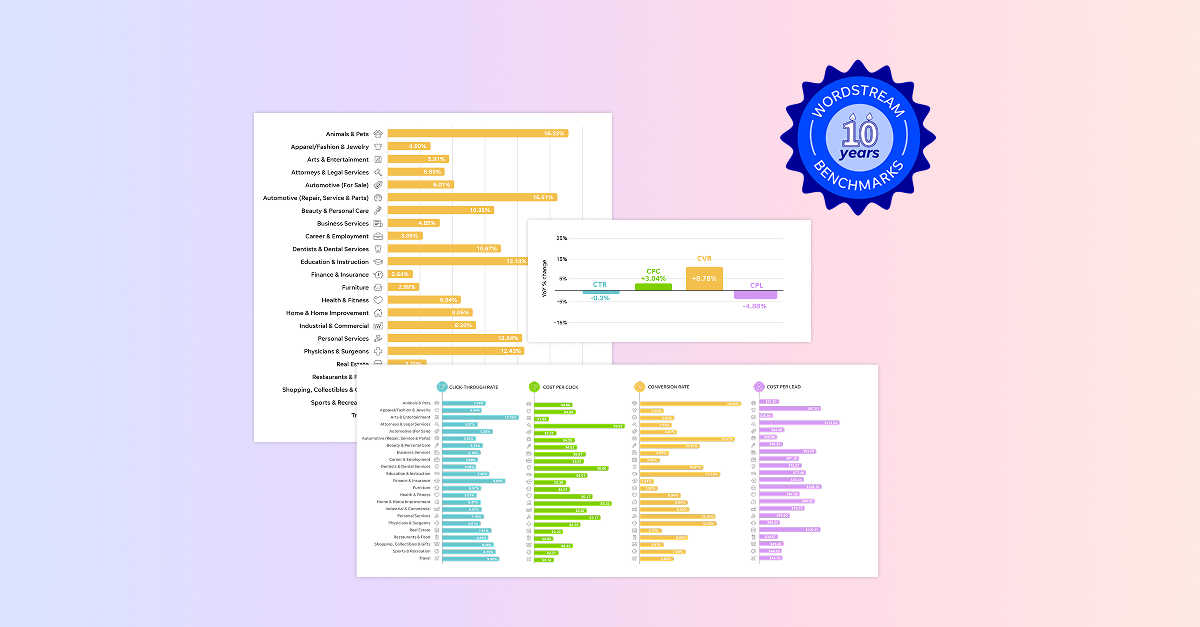
Google Ads Benchmarks 2026: Competitive Data & Insights for Every Industry
See the latest Google Ads benchmarks for your industry plus exclusive expert insights on what this data means for your business.

46 Father’s Day Messages & Quotes for All Your Marketing Needs (+Templates)
Use these inclusive and creative Father's Day messages for your emails, social posts, SMS marketing, and more.

5 OTT Advertising Examples (+Over-The-Top Ads Explained)
OTT advertising delivers a huge audience and advanced targeting features. Learn how to use it from successful brands.

Ad Scheduling: How to Set It Up Right In Google, Meta, & Microsoft Ads
Ad scheduling is a huge money-saver, but the process has nuances across Google, Microsoft, and Meta. Learn how (and why) to set it up on each platform.

58 Free June Marketing Ideas for Sizzling Campaigns
Kick off the summer with these creative and inclusive ideas for social, email, blog, promos, events, and more!

Our 21 Best Social Media Optimization Tactics (With Examples)
This social media optimization guide will help you get found where people search for new brands and products.
Brand Personality: Definition, Examples, & How to Build Your Own
Learn how to develop and present your brand personality so it attracts the right customers.

How to Do Keyword Research (+Best Tips & Tools!)
Intimidated by the prospect of keyword research? Don't be! This guide tells you exactly how to do keyword research for SEO and PPC! Plus we share our five favorite keyword research tools.
How to Build Local Citations & Boost Your Visibility Online
Local citations can help you get found in more places online and boost your local SEO. Learn everything you need to know to build them.

How AI Is Changing the Buyer’s Journey (+What to Do About It)
AI is changing the buyer's journey. Here's how and what you do can about it to not only get seen--but get chosen.

How to Build Brand Awareness (23 Ideas & Expert Tips)
Get everything you need to launch a successful brand awareness strategy.
How to Lower Your Cost Per Click in Google Ads & Meta Ads
Find essential tips to lower your cost per click on Google Ads and Meta Ads to stretch your budget further.

3 Huge Ways AI Impacts Your Content Strategy & How to Pivot
Here are the three biggest ways we see AI impacting content marketing and what to do about them so you can make the most of your strategy.

31 Call to Action Examples + How to Write Your Own
The right CTA can boost conversions big time, and these call-to-action examples will help you write them.
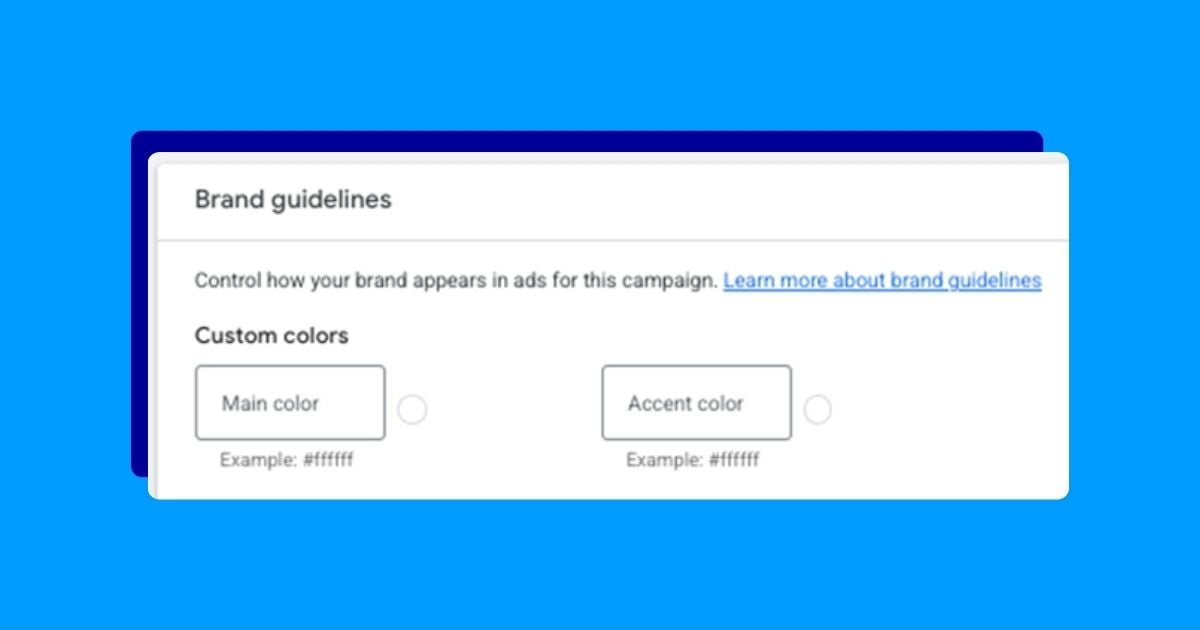
How to Use Google Ads Brand Guidelines for Cleaner Automated Assets
Google Ads brand guidelines keep your automatically generated assets in line with your brand. Find out how to use them right.

15 Tiny Copy Tweaks That Immediately Improve Conversions
You don’t need a redesign or a full rewrite to improve conversions. You just need a handful of reliable copy tweaks we're providing here.

How Much Do TikTok Ads Cost in 2026?
Find out how much TikTok ads cost and learn how to optimize your budget there.

90+ May Marketing Ideas & Examples for Any Budget
Connect with your customers in meaningful, memorable ways this month with your blog and social posts, emails, and more!

SEO A/B Testing: 5 Easy Experiments to Drive Traffic
These SEO A/B testing tactics will inform your strategy and have your site ranking in more SERPs.